. 2012 Mar 21;32(12):4145-55.
doi: 10.1523/JNEUROSCI.6338-11.2012.

Mitofusin2 mutations disrupt axonal mitochondrial positioning and promote axon degeneration

Affiliations

Mitofusin2 mutations disrupt axonal mitochondrial positioning and promote axon degeneration

Albert L Misko et al. J Neurosci. .

Abstract

Alterations in mitochondrial dynamics (fission, fusion, and movement) are implicated in many neurodegenerative diseases, from rare genetic disorders such as Charcot-Marie-Tooth disease, to common conditions including Alzheimer's disease. However, the relationship between altered mitochondrial dynamics and neurodegeneration is incompletely understood. Here we show that disease associated MFN2 proteins suppressed both mitochondrial fusion and transport, and produced classic features of segmental axonal degeneration without cell body death, including neurofilament filled swellings, loss of calcium homeostasis, and accumulation of reactive oxygen species. By contrast, depletion of Opa1 suppressed mitochondrial fusion while sparing transport, and did not induce axonal degeneration. Axon degeneration induced by mutant MFN2 proteins correlated with the disruption of the proper mitochondrial positioning within axons, rather than loss of overall mitochondrial movement, or global mitochondrial dysfunction. We also found that augmenting expression of MFN1 rescued the axonal degeneration caused by MFN2 mutants, suggesting a possible therapeutic strategy for Charcot-Marie-Tooth disease. These experiments provide evidence that the ability of mitochondria to sense energy requirements and localize properly within axons is key to maintaining axonal integrity, and may be a common pathway by which disruptions in axonal transport contribute to neurodegeneration.


Figures
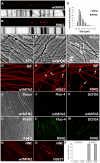
Figure 1.
Figure 1.
Disruption of mitochondrial dynamics by MFN2 mutants causes selective axonal degeneration in cultured sensory neurons. A, B, Mitochondria in cultured DRG neurons expressing virally transduced wtMFN2 or R94Q constructs were labeled with mito-RFP, imaged by time-lapse microscopy, and analyzed using kymographs. Axonal mitochondria in R94Q-expressing neurons show diminished frequency and speed of movements 3 d postinfection (A, B, kymographs). Quantification of mitochondrial flux (number of mitochondria passing a single point) supported a decrease in mitochondrial mobility in R94Q-expressing neurons (number of mitochondria/min: wtMFN2, 2.03 ± 1.16; R94Q, 0.33 ± 0.27; p = 0.002; n = 10 axons per condition). C, Size frequency histogram demonstrating shorter mitochondrial lengths in R94Q-expressing neurons, indicating disruption of mitochondrial fusion. D–F, Phase imaging revealed dilated axon segments reminiscent of degenerating axon spheroids in neurons expressing R94Q but not RFP or wtMFN2, 7–10 d postinfection. G–I, Staining with anti-neurofilament antibody (NF) highlighted dilated axon segments. J–O, Degenerating segments showed increased intra-axonal Ca2+ (Fluo-4; J′, L′) and markers of reactive oxygen species [via DCFDA dye—K, M; confirmed with hydroxynonenol (HNE) immunostaining—N, O]. P, Despite ongoing axonal degeneration, propidium iodide (PI) staining showed normal numbers of cell bodies, indicating a selective effect of altered mitochondrial dynamics by MFN2 mutants on axonal maintenance. Ionomycin treatment-induced cell death is shown as a positive control for the PI staining assay.
Figure 2.
Figure 2.
Axon degeneration caused by MFN2 mutant expression is segmental and dynamic. A–C, Fluo-4 imaging of MFN2 mutant-expressing axons (7 d after infection) visualized by time-lapse microscopy (40× magnification). Axons demonstrated a rapid (minutes) elevation in intra-axonal Ca2+, followed by beading of the membrane and finally disappearing, presumably from the inability to retain dye following loss of membrane integrity. B, These frequently appeared as short segments (∼50–100 μm) which swelled to a spheroid like shape before completely degenerating. C, Axons often lost structural integrity at a single point resulting in retraction of then ends from the break point (asterisks label ends of break point). D–G, Corresponding phase contrast and Fluo-4 images illustrate degenerating axon segments.
Figure 3.
Figure 3.
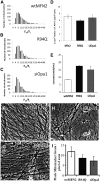
Disruption of mitochondrial fusion alone is not sufficient to induce axonal degeneration. DRG neurons were infected with lentivirus expressing siRNA to Opa1 (siOpa1) or luciferase (control) to inhibit mitochondrial fusion, together with mito-RFP to visualize mitochondrial dynamics via live cell imaging. A–C, Knock-down of Opa1 leaves mitochondrial transport intact (A, B, kymographs) but results in smaller fragmented mitochondria due to diminished fusion (C). Quantification of mitochondrial flux supported normal mitochondrial mobility in siOpa1-expressing neurons (number of mitochondria/min: siLuc, 2.87 ± 1.87; siOpa1, 2.71 ± 1.51; p = 0.828; n = 10 axons per condition). Unlike expression of MFN2 mutant-expressing neurons, Fluo-4 imaging detected no signs of axonal degeneration in Opa1 deficient neurons (D,D′, E,E′).
Figure 4.
Figure 4.
Mutant MFN2 and Opa1 knockdown cause similar global suppression of mitochondrial function. A–C, TMRM dye was used to calculate Fm/Fc (an estimate of Δψ that corrects for cytoplasmic background) values of mitochondria in wtMFN2 (A)-, R94Q (B)-, and siOpa1 (C)-expressing cells. Mitochondria in siOpa1 showed a trend toward lower Δψ values, while R94Q expression did not significantly alter Δψ values. D, E, Despite normal levels of ATP in the cultures (D), R94Q- and siOpa1-expressing cultures contained more lactate in the medium, indicating a shift toward the use of glycolysis to maintain ATP levels (E). F, G, H, Treatment of cultures with 15 mm 2DG to inhibit glycolysis for 48 h produced widespread axonal degeneration (as indicated by axonal blebbing seen on phase contrast images) in R94Q- and siOpa1-expressing cultures, supporting the notion that the axons are more reliant on glycolysis to maintain ATP levels. I, MitoTracker Green staining of R94Q- and siOpa1-expressing cultures revealed an ∼20% and 40% decrease in mitochondrial mass, respectively.
Figure 5.
Figure 5.
Decreasing overall mitochondrial movement alone does not cause axonal degeneration. Synph, which anchors mitochondria to microtubules, was overexpressed by lentivirus infection and mitochondrial motility and axonal viability were examined. A, B, Overall mitochondrial movement was dramatically reduced in Synph-overexpressing neurons (number of mitochondria/min: GFP, 2.71 ± 1.23 vs Synph, 1.09 ± 0.70, p < 0.0001; n = 20 axons per condition). C, A size frequency histogram of mitochondrial lengths demonstrated that Synph overexpression suppressed movement without altering mitochondrial fission/fusion dynamics. D,D′, E,E′, Despite the near complete suppression of mitochondrial movement, degenerating axons were rarely observed in Synph-expressing cultures. Note also that despite lack of movement, the distribution of mitochondria along the axon appeared to be preserved.
Figure 6.
Figure 6.
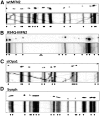
Abnormal distribution of axonal mitochondria correlates with axonal degeneration from mutant MFN2 expression. Mitochondria in cultured DRG neurons expressing virally transduced wtMFN2, R94Q, siOpa1 or Synph were labeled with mito-RFP and imaged by time-lapse microscopy 1 week after infection. A–D, Kymographs were used to assist in the identification of fluorescently labeled mitochondria. Individual mitochondria are represented as black dots below kymographs. While mitochondria were evenly distributed along axons of wtMFN2-, Synph-, and siOpa1-expressing neurons (A, C, D), R94Q mutant-expressing axons commonly displayed prolonged segments that were devoid of mitochondria (B, arrowhead). Axons from 10 neurons were divided into 10 μm bins (length of bracket in A) and the number of mitochondria counted per bin. Mitochondrial distributions were compared with a Poisson distribution with a χ2 goodness of fit test as described in the text and shown in Table 1.
Figure 7.
Figure 7.
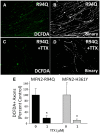
TTX treatment diminishes axonal degeneration in cultured DRG neurons expressing MFN2 disease mutants. DRG cultures expressing the R94Q or H361Y MFN2 disease mutants to induce axon degeneration were treated with 1 μm TTX on DIV4 through DIV11. A–D, DCFDA imaging after 1 week of treatment showed a marked decrease in the number of degenerating axons (A, C). Fluorescence images were converted into binary format (B, D) and degenerating axons were measured as DCFDA+ pixels per field. E, DRG neurons expressing MFN2 mutants treated with TTX showed a significant decrease in the number of DCFDA-positive degenerating axons 1 week after infection with R94Q or H361Y viral constructs (TTX treatment vs untreated control, *p < 0.01, Student's t test). Control in this experiment refers to MFN2 mutant-expressing cultures, compared with treatment with TTX.
Figure 8.
Figure 8.
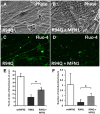
Expression of Mfn1 rescues axonal degeneration induced by MFN2 disease mutants. A–D, Cultured DRG neurons were infected with R94Q mutant MFN2 on DIV3, and subsequently infected with control or Mfn1 constructs on DIV4. Whereas Fluo-4 imaging showed frequent degenerating axons in cultured neurons expressing R94Q-MFN2 as before, cultures coinfected with Mfn1 and R94Q-MFN2 showed no signs of axonal degeneration 7 d after infection. E, F, Expression of Mfn1 rescued mitochondrial transport, as measured both by the amount of mitochondria migrating into axons after infection with mito-DsRed2 virus (E; *p < 0.001, Student's t test), and frequency of mitochondrial movement measured as mitochondria/per minute crossing an arbitrary point along the axon (F; *p < 0.001, Student's t test).

References

    1. Abhyankar MM, Urekar C, Reddi PP. A novel CpG-free vertebrate insulator silences the testis-specific SP-10 gene in somatic tissues: role for TDP-43 in insulator function. J Biol Chem. 2007;282:36143–36154. - PubMed
    1. Alvarez S, Moldovan M, Krarup C. Acute energy restriction triggers Wallerian degeneration in mouse. Exp Neurol. 2008;212:166–178. - PubMed
    1. Amiri M, Hollenbeck PJ. Mitochondrial biogenesis in the axons of vertebrate peripheral neurons. Dev Neurobiol. 2008;68:1348–1361. - PMC - PubMed
    1. Andrews H, White K, Thomson C, Edgar J, Bates D, Griffiths I, Turnbull D, Nichols P. Increased axonal mitochondrial activity as an adaptation to myelin deficiency in the Shiverer mouse. J Neurosci Res. 2006;83:1533–1539. - PubMed
    1. Baloh RH. Mitochondrial dynamics and peripheral neuropathy. Neuroscientist. 2008;14:12–18. - PubMed

Publication types

MeSH terms