. 2012 Mar 21;32(12):4307-18.
doi: 10.1523/JNEUROSCI.5061-11.2012.

Topologically convergent and divergent structural connectivity patterns between patients with remitted geriatric depression and amnestic mild cognitive impairment

Affiliations

Topologically convergent and divergent structural connectivity patterns between patients with remitted geriatric depression and amnestic mild cognitive impairment

Feng Bai et al. J Neurosci. .

Abstract

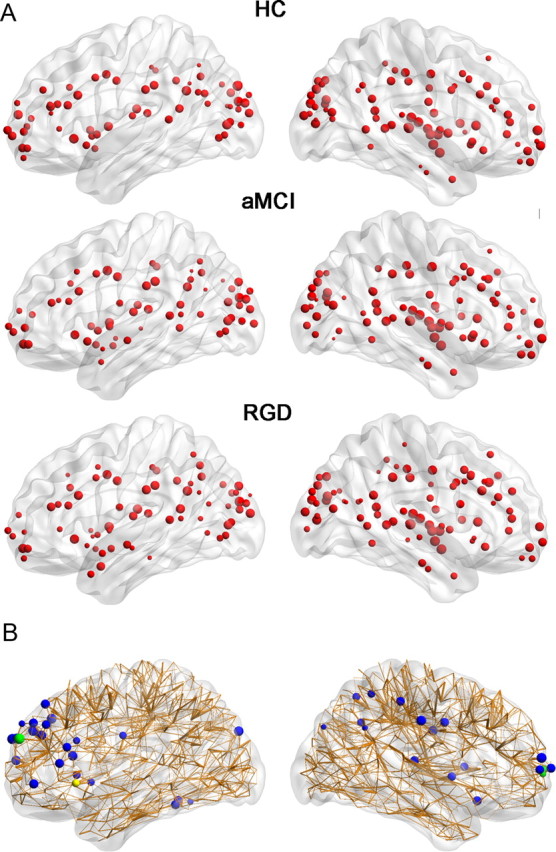
Alzheimer's disease (AD) can be conceptualized as a disconnection syndrome. Both remitted geriatric depression (RGD) and amnestic mild cognitive impairment (aMCI) are associated with a high risk for developing AD. However, little is known about the similarities and differences in the topological patterns of white matter (WM) structural networks between RGD and aMCI. In this study, diffusion tensor imaging and deterministic tractography were used to map the human WM networks of 35 RGD patients, 38 aMCI patients, and 30 healthy subjects. Furthermore, graph theoretical methods were applied to investigate the alterations in the global and regional properties of the WM network in these patients. First, both the RGD and aMCI patients showed abnormal global topology in their WM networks (i.e., reduced network strength, reduced global efficiency, and increased absolute path length) compared with the controls, and there were no significant differences in these global network properties between the patient groups. Second, similar deficits of the regional and connectivity characteristics in the WM networks were primarily found in the frontal brain regions of RGD and aMCI patients compared with the controls, while a different nodal efficiency of the posterior cingulate cortex and several prefrontal brain regions were also observed between the patient groups. Together, our study provides direct evidence for the association of a great majority of convergent and a minority of divergent connectivity of WM structural networks between RGD and aMCI patients, which may lead to increasing attention in defining a population at risk of AD.


Figures

Figure 1.
Figure 1.
A flow chart for the construction of the WM structural network by DTI. (1) The rigid coregistration from the T1-weighted structural MRI (b) to the DTI native space (a) (DTI color-coded map; red: left to right; green: anterior to posterior; blue: inferior to superior) for each subject. (2) The nonlinear registration from the resultant structural MRI to the ICBM152 T1 template in the MNI space (c), resulting in a nonlinear transformation (T). (3) The application of the inverse transformation (T−1) to the AAL template in the MNI space (e), resulting in a subject-specific AAL mask in the DTI native space (f). All of the registrations were implemented in the SPM8 package. (4) The reconstruction of all of the WM fibers (d) in the whole brain using DTI deterministic tractography in DTI-Studio. (5) The weighted networks of each subject were created by computing the fiber numbers (FN-weighted) that connected each pair of brain regions. The matrices and 3D representations (lateral view) of the mean WM structural networks of each group are shown in the bottom panel (g). The nodes and connections were mapped onto the cortical surfaces using the in-house BrainNet viewer software (www.nitrc.org/projects/bnv/). For details, see Materials and Methods. HC, Healthy controls.
Figure 2.
Figure 2.
Global measures of WM structural networks were quantified in the control, aMCI, and RGD patients. The threshold (horizontal axis) determined the minimum number of streamlines that needed to interconnect a pair of nodes for a connection to be assumed. The data points are marked with an asterisk to indicate a significant difference (p < 0.05) among the three groups. Note that T = n (1, 2, 3, 4, 5) indicates at least n or more streamlines must be present for a link to be drawn. Significant group effects in the network strength, global efficiency, and absolute path length were observed for most of the thresholds. Note that the FN-weighted WM network for each participant was constructed using the AAL template. HC, Healthy controls.
Figure 3.
Figure 3.
Three-dimensional representations of the hub distributions in the control, aMCI, and RGD groups. The hub nodes are shown in red with node sizes that represent their nodal efficiency values. The regions were mapped onto the cortical surface at a lateral view. The nodal regions were located according to their centroid stereotaxic coordinates. Note that the FN-weighted WM network for each participant was constructed using the AAL template. HC, Healthy controls. For the abbreviations of the nodes, see Table 1.
Figure 4.
Figure 4.
The distribution of brain regions with significant group effects in the nodal efficiency among the three groups at p < 0.05 (uncorrected). The node sizes indicate the significance of between-group differences in the regional efficiency. For each node, the bar and error bar represent the mean value and SD, respectively, of the nodal efficiency in each group. Post hoc tests showed that most of these regions (10 of 11) have a reduced efficiency in the aMCI patients versus the controls. Six of these regions, including the left SFGmed, bilateral SFGdor, left MFG, left ACG, and left PreCG showed a reduced efficiency in the RGD patients compared with the controls. Only one region (right PCG) showed significant group differences between the RGD and aMCI patients, with a higher efficiency in RGD than in aMCI. A single asterisk (*) represents a significant group difference at p < 0.05; a double asterisk (**) represents a significant group difference at p < 0.01. The network shown here was constructed by averaging the anatomical connection matrices of all healthy controls with a threshold of a sparsity of 10%. Note that the FN-weighted WM network for each participant was constructed using the AAL template. The nodes and connections were mapped onto the cortical surfaces using in-house BrainNet viewer software (www.nitrc.org/projects/bnv/). HC, Healthy controls. For the abbreviations of the nodes, see Table 1.
Figure 5.
Figure 5.
The connected networks showing decreased structural connections in the aMCI and RGD patients compared with the controls. A, The regional pairs showing decreased connections in the aMCI patients. These connections formed a single connected network with 33 nodes and 35 connections (p = 0.002, corrected). B, The regional pairs showing decreased connections in the RGD patients. These connections formed a single connected network with 18 nodes and 19 edges in right hemisphere (p = 0.015, corrected). Between the aMCI and RGD patients, no connected components with significant difference were found. Note that the FN-weighted WM network for each participant was constructed using the AAL template. The nodes and connections were mapped onto the cortical surfaces using in-house BrainNet viewer software (www.nitrc.org/projects/bnv/).
Figure 6.
Figure 6.
Hub distributions and regional differences of high-resolution networks (H-1024) in the HC, aMCI, and RGD groups. A, Three-dimensional representations of the hub distributions in the control, aMCI, and RGD groups. The hub nodes are shown in red with the node sizes representing their nodal efficiency values. The regions were mapped onto the cortical surface at a lateral view. B, The distribution of the nodes exhibited significant group effects in the nodal efficiency among the three groups at p < 0.005 (uncorrected). The node sizes indicate the significance of between-group differences in the regional efficiency. Post hoc tests showed that most of the nodes (36 of 42) exhibited a reduced efficiency in both of the aMCI and RGD patients relative to the controls. Between the aMCI and RGD groups, three nodes in the prefrontal cortex (in green) have a reduced efficiency in the RGD patients than the aMCI patients. One node in the left inferior frontal gyrus (in yellow) showed a reduced efficiency in the aMCI patients compared with the RGD patients. The network shown here was constructed by averaging the anatomical connection matrices of all of the healthy controls with a threshold of a sparsity of 1%. The nodes and connections were mapped onto the cortical surfaces using in-house BrainNet viewer software (www.nitrc.org/projects/bnv/).

References

    1. Achard S, Bullmore E. Efficiency and cost of economical brain functional networks. PLoS Comput Biol. 2007;3:e17. - PMC - PubMed
    1. Alexopoulos GS, Murphy CF, Gunning-Dixon FM, Latoussakis V, Kanellopoulos D, Klimstra S, Lim KO, Hoptman MJ. Microstructural white matter abnormalities and remission of geriatric depression. Am J Psychiatry. 2008;165:238–244. - PubMed
    1. Bae JN, MacFall JR, Krishnan KR, Payne ME, Steffens DC, Taylor WD. Dorsolateral prefrontal cortex and anterior cingulate cortex white matter alterations in late-life depression. Biol Psychiatry. 2006;60:1356–1363. - PubMed
    1. Bai F, Zhang Z, Watson DR, Yu H, Shi Y, Yuan Y, Qian Y, Jia J. Abnormal integrity of association fiber tracts in amnestic mild cognitive impairment. J Neurol Sci. 2009a;278:102–106. - PubMed
    1. Bai F, Zhang Z, Watson DR, Yu H, Shi Y, Yuan Y, Zang Y, Zhu C, Qian Y. Abnormal functional connectivity of hippocampus during episodic memory retrieval processing network in amnestic mild cognitive impairment. Biol Psychiatry. 2009b;65:951–958. - PubMed

Publication types