. 2012 May 11;287(20):16768-80.
doi: 10.1074/jbc.M111.329912. Epub 2012 Mar 22.

Cell type-specific β2-adrenergic receptor clusters identified using photoactivated localization microscopy are not lipid raft related, but depend on actin cytoskeleton integrity

Affiliations

Cell type-specific β2-adrenergic receptor clusters identified using photoactivated localization microscopy are not lipid raft related, but depend on actin cytoskeleton integrity

Marco Scarselli et al. J Biol Chem. .

Abstract

Recent developments in the field of optical super-resolution techniques allow both a 10-fold increase in resolution as well as an increased ability to quantify the number of labeled molecules visualized in the fluorescence measurement. By using photoactivated localization microscopy (PALM) and an experimental approach based on the systematic comparison with a nonclustering peptide as a negative control, we found that the prototypical G protein-coupled receptor β2-adrenergic receptor is partially preassociated in nanoscale-sized clusters only in the cardiomyocytes, such as H9C2 cells, but not in other cell lines, such as HeLa and Chinese hamster ovary (CHO). The addition of the agonist for very short times or the addition of the inverse agonist did not significantly affect the organization of receptor assembly. To investigate the mechanism governing cluster formation, we altered plasma membrane properties with cholesterol removal and actin microfilament disruption. Although cholesterol is an essential component of cell membranes and it is supposed to be enriched in the lipid rafts, its sequestration and removal did not affect receptor clustering, whereas the inhibition of actin polymerization did decrease the number of clusters. Our findings are therefore consistent with a model in which β2 receptor clustering is influenced by the actin cytoskeleton, but it does not rely on lipid raft integrity, thus ruling out the possibility that cell type-specific β2 receptor clustering is associated with the raft.


Figures

FIGURE 1.
FIGURE 1.
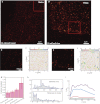
PALM image of the nonclustering peptide SrcN15-mEos2 on the plasma membrane of HeLa cells. a, PALM image in TIRF fluorescence geometry of a small peptide of 15 amino acids of the protein Src (the nonclustering peptide SrcN15-mEos2) on the plasma membrane of fixed HeLa cells. Images that are shown are representative of experiments that were repeated at least five times. b, magnified view of boxed region in a. c, schematic representation of the molecule distribution of the inset in a to visualize clusters (different colors represent clustering degree). d, quantification of the fraction clustered of the nonclustering peptide (negative control) labeled with two different fluorophores, SrcN15-mEos2 and SrcN15-PSCFP2. The bar graph shows the fraction clustered as the average ± S.E.
FIGURE 2.
FIGURE 2.
PALM images and cluster analysis of the β2 receptor labeled with mEos2 (β2-mEos2) on the plasma membrane of HeLa cells before and after agonist addition. a, PALM image in TIRF geometry of β2-mEos2 in basal conditions on the plasma membrane of fixed HeLa cells. Images that are shown are representative of experiments that were repeated at least five times. b, magnified view of boxed region in a. c, schematic representation of the molecule distribution of the inset to visualize clusters (different colors represent clustering degree). d, PALM image in TIRF geometry of β2-mEos2 on the plasma membrane of fixed HeLa cells after incubation with the agonist (isoproterenol 10 μm, 10 min) during endocytosis. Images that are shown are representative of experiments that were repeated at least five times. e, magnified view of boxed region in d. f, schematic representation of the molecule distribution of the inset to visualize clusters. g, quantification of the clustered fraction in HeLa of the β2-mEos2 basal state, β2-mEos2 + Iso (isoproterenol 10 μm, 10 min), β2-mEos2 + Iso + Dyn (dynasore 80 μm) compared with the negative control (the nonclustering peptide SrcN15-mEos2). Dynasore is an inhibitor of clathrin-dependent endocytosis. The bar graph shows the fraction clustered as the average ± S.E. h, bottom, histogram representing the distribution of the number of molecules present in the clusters (Events) of β2-mEos2 during endocytosis in the presence of agonist (isoproterenol 10 μm, 10 min) and dynasore 80 μm. Top, histogram representing the distribution of the cluster diameter size of β2-mEos2 during endocytosis in the presence of agonist (isoproterenol 10 μm, 10 min) and dynasore 80 μm. i, the degree of clustering for the experiments was determined by Ripley's K function analysis and L(r) − r parameter that displays the magnitude of deviations from a random distribution as positive y values (normalized to 99% confidence interval). Data are representative of experiments that were repeated at least three times. SrcN15-mEos2 (green curve), β2-mEos2 basal state (red curve), β2-mEos2 + Iso (blue curve), β2-mEos2 + Iso + Dyn (violet curve) are indicated.
FIGURE 3.
FIGURE 3.
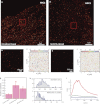
PALM images and cluster analysis of β2-mEos2 on the plasma membrane of the H9C2 cell line derived from embryonic rat heart. a, PALM image in TIRF geometry of β2-mEos2 in basal conditions on the plasma membrane of fixed H9C2 cells. Images that are shown are representative of experiments that were repeated at least five times. b, magnified view of boxed region in a. c, schematic representation of the molecule distribution of the inset to visualize clusters (different colors represent clustering degree). d, PALM image in TIRF geometry of the nonclustering peptide SrcN15-mEos2 on the plasma membrane of fixed H9C2 cells. Images that are shown are representative of experiments that were repeated at least five times. e, magnified view of boxed region in d. f, schematic representation of the molecules distribution of the inset to visualize clusters. g, quantification of the fraction clustered of the negative control SrcN15-mEos2, β2-mEos2 in basal conditions, and β2-mEos2 in the presence of the agonist for very short times (10 μm isoproterenol, 5 s). The bar graph shows the fraction clustered as the average ± S.E. (*, p = 0.0023; one-tailed test). h, bottom, histogram representing the distribution of the number of molecules present in the cluster of β2-mEos2 in basal conditions. Top, histogram representing the distribution of the cluster diameter size of β2-mEos2 in basal conditions. i, the degree of clustering for the experiments was determined by Ripley's K function analysis and L(r) − r parameter that displays the magnitude of deviations from a random distribution as positive y values (normalized to 99% confidence interval). Data are representative of experiments that were repeated at least three times. SrcN15-mEos2 (green curve) and β2-mEos2 basal state (red curve) are indicated.
FIGURE 4.
FIGURE 4.
PALM images and cluster analysis of β2-mEos2 on the plasma membrane of H9C2 cells after cholesterol sequestration or actin microfilament disruption. a and b, PALM images in total internal reflection fluorescence geometry of β2-mEos2 on the plasma membrane of fixed H9C2 cells in basal condition (a), and after actin cytoskeleton disruption (b). c, the degree of clustering for the experiments shown was determined by Ripley's K function analysis and L(r) − r parameter that displays the magnitude of deviations from a random distribution as the positive y values (normalized to 99% confidence interval). Data are representative of experiments that were repeated at least three times. Cholesterol inactivation was obtained by preincubating cells with filipin for 30 min at the concentration of 12 μg/ml or MβDC with a preincubation of 30 min at 5 mm, whereas actin microfilament disruption was performed by preincubating for 30 min with cytochalasin D at 2 μm. d, concentration-response curve in the cAMP accumulation assay in H9C2 cells expressing β2-mEos2 in the presence of cytochalasin D (β2-mEos2-actin, blue curve) or β2-mEos2 without cytochalasin D (β2-mEos2, red curve). The EC50 resulted in 7.10 ± 1.51 and 8.74 ± 0.74 nm, respectively. These data are representative of three different experiments.
FIGURE 5.
FIGURE 5.
PALM images and cluster analysis of β2-mEos2 and nonclustering peptide SrcN15-mEos2 on supported cell-membrane sheets of H9C2 cells. a, PALM image in TIRF geometry of β2-mEos2 in basal conditions on H9C2 membrane sheets obtained by transferring plasma membrane onto poly-l-lysine-coated coverslips and then fixing. Images are representative of experiments that repeated at least three times. b, magnified view of boxed region in a. c, schematic representation of the molecule distribution of the inset to visualize clusters (different colors represent clustering degree). d, PALM image in TIRF geometry of the nonclustering peptide SrcN15-mEos2 on H9C2 membrane sheets obtained using the same condition as in a. e, magnified view of boxed region in d. f, schematic representation of the molecule distribution of the inset to visualize clusters. g, the degree of clustering for β2-mEos2 and SrcN15-mEos2 was determined by Ripley's K function analysis and L(r) − r parameter that displays the magnitude of deviations from a random distribution as positive y values (normalized to 99% confidence interval). Data are representative of experiments that were repeated at least three times. h, schematic representation of the experimental procedure used to obtain the membrane sheets (patches) onto poly-l-lysine-coated coverslips. Following the protocol of Perez et al. (21), a poly-l-lysine-coated coverslip was put on top of the cells for few minutes and then removed allowing the transfer of the membrane patches onto the glass coverslip.

References

    1. Harding A. S., Hancock J. F. (2008) Using plasma membrane nanoclusters to build better signaling circuits. Trends Cell Biol. 18, 364–371 - PMC - PubMed
    1. Manz B. N., Groves J. T. (2010) Spatial organization and signal transduction at intercellular junctions. Nat. Rev. Mol. Cell Biol. 11, 342–352 - PMC - PubMed
    1. Bethani I., Skånland S. S., Dikic I., Acker-Palmer A. (2010) Spatial organization of transmembrane receptor signaling. EMBO J. 29, 2677–2688 - PMC - PubMed
    1. Patel H. H., Murray F., Insel P. A. (2008) G-protein-coupled receptor-signaling components in membrane raft and caveolae microdomains. Handb. Exp. Pharmacol. 186, 167–184 - PubMed
    1. Jacobson K., Mouritsen O. G., Anderson R. G. (2007) Lipid rafts, at a crossroad between cell biology and physics. Nat. Cell Biol. 9, 7–14 - PubMed

Publication types