. 2012 May;11(5):77-89.
doi: 10.1074/mcp.M111.015362. Epub 2012 Mar 21.

Super-SILAC allows classification of diffuse large B-cell lymphoma subtypes by their protein expression profiles

Affiliations

Super-SILAC allows classification of diffuse large B-cell lymphoma subtypes by their protein expression profiles

Sally J Deeb et al. Mol Cell Proteomics. 2012 May.

Abstract

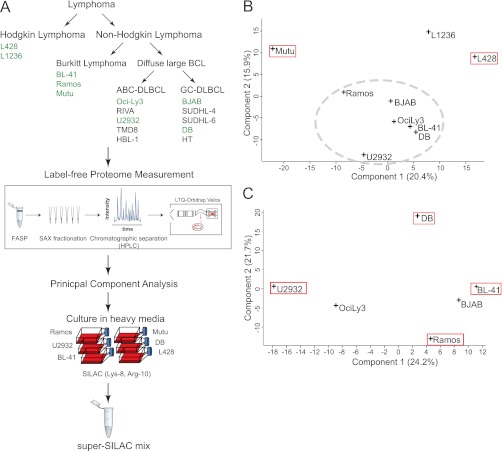
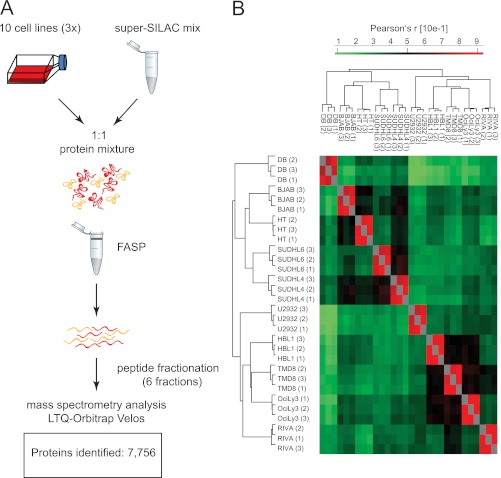
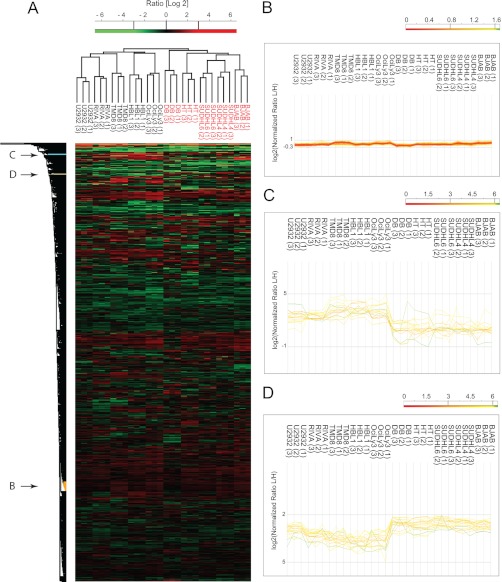
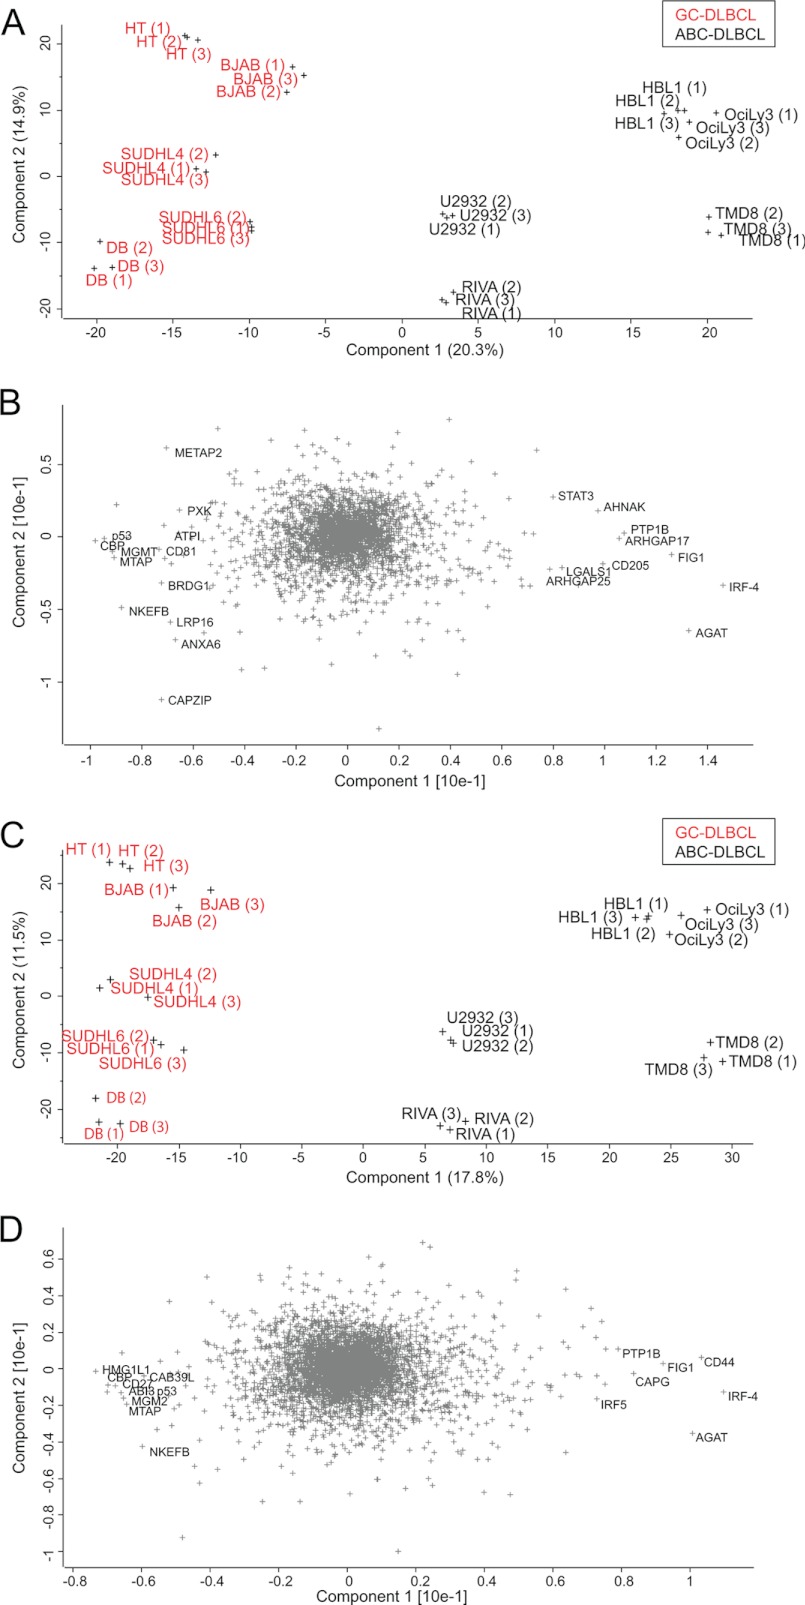
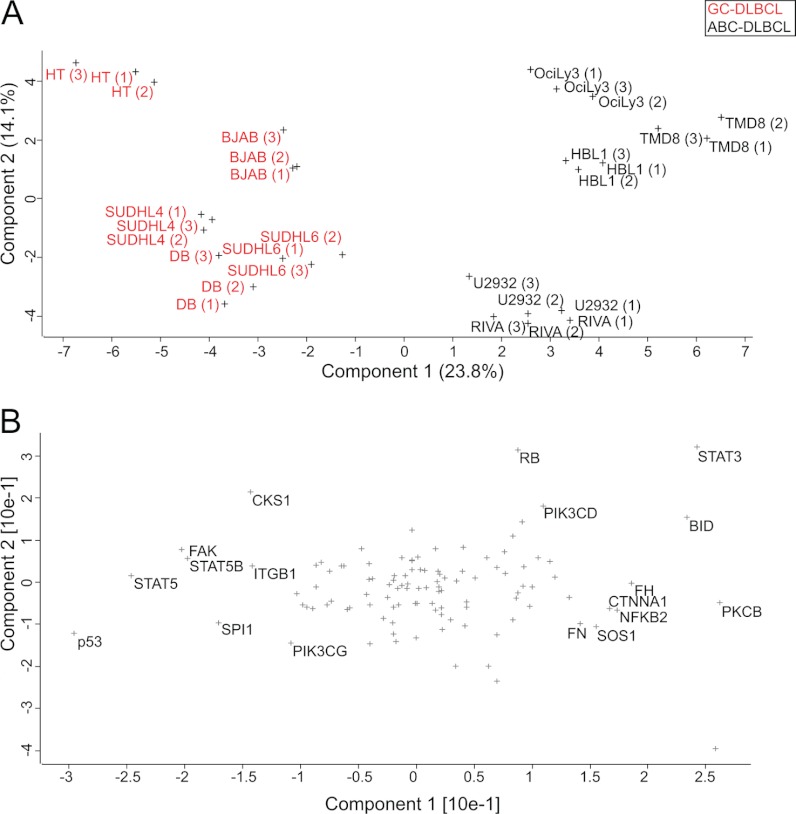
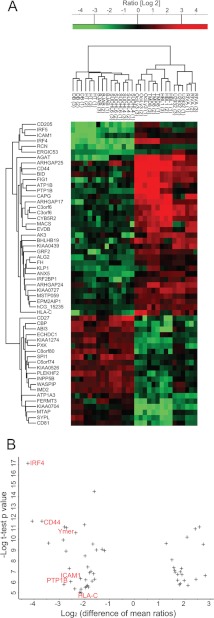
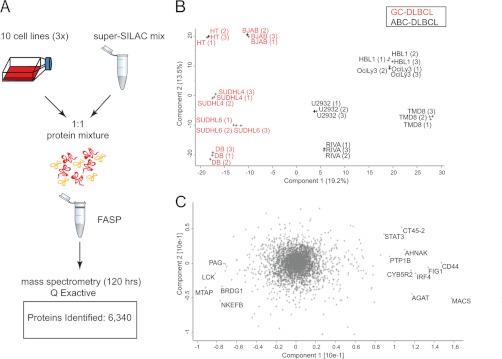
Correct classification of cancer patients into subtypes is a prerequisite for acute diagnosis and effective treatment. Currently this classification relies mainly on histological assessment, but gene expression analysis by microarrays has shown great promise. Here we show that high accuracy, quantitative proteomics can robustly segregate cancer subtypes directly at the level of expressed proteins. We investigated two histologically indistinguishable subtypes of diffuse large B-cell lymphoma (DLBCL): activated B-cell-like (ABC) and germinal-center B-cell-like (GCB) subtypes, by first developing a general lymphoma stable isotope labeling with amino acids in cell culture (SILAC) mix from heavy stable isotope-labeled cell lines. This super-SILAC mix was combined with cell lysates from five ABC-DLBCL and five GCB-DLBCL cell lines. Shotgun proteomic analysis on a linear ion trap Orbitrap mass spectrometer with high mass accuracy at the MS and MS/MS levels yielded a proteome of more than 7,500 identified proteins. High accuracy of quantification allowed robust separation of subtypes by principal component analysis. The main contributors to the classification included proteins known to be differentially expressed between the subtypes such as the transcription factors IRF4 and SPI1/PU.1, cell surface markers CD44 and CD27, as well as novel candidates. We extracted a signature of 55 proteins that segregated subtypes and contained proteins connected to functional differences between the ABC and GCB-DLBCL subtypes, including many NF-κB-regulated genes. Shortening the analysis time to single-shot analysis combined with use of the new linear quadrupole Orbitrap analyzer (Q Exactive) also clearly differentiated between the subtypes. These results show that high resolution shotgun proteomics combined with super-SILAC-based quantification is a promising new technology for tumor characterization and classification.


Figures

Fig. 1.
Fig. 1.
Rational construction of lymphoma super-SILAC mix. A, label-free proteomics of nine B-cell lymphoma cell lines was performed after FASP-SAX processing and analyzed using high resolution precursor and fragment measurements on an Orbitrap Velos. They included two Hodgkin lymphoma cell lines (L428 and L1236) and seven non-Hodgkin lymphoma cell lines (Ramos, Mutu, BL-41, OciLy3, U2932, BJAB, and DB). B, PCA of nine B-cell lymphoma cell lines based on their protein expression profiles. The red boxes indicate cell lines selected for the super-SILAC mix. The gray dashed ellipse groups non-Hodgkin lymphoma cell lines to be further analyzed by a second PCA. C, PCA of the six non-Hodgkin lymphoma cell lines encircled in B. The red boxes indicate cell lines selected for the super-SILAC mix.
Fig. 2.
Fig. 2.
Proteomic workflow and overall results. A, the super-SILAC mix developed on the basis of label-free proteome comparison was used as an internal standard for 10 different DLBCL cell lines. The samples were processed by FASP-SAX followed by triplicate 1-day proteome analyses. B, heat map of Pearson correlation coefficients showing reproducibility between replicates.
Fig. 3.
Fig. 3.
Unsupervised hierarchical clustering. A, unsupervised clustering of protein expression profiles of 10 DLBCL cell lines after filtering for 50% valid values and imputation of missing values. B, expression patterns for a cluster enriched for ribosomal and proteasomal proteins. C, expression patterns for a cluster of proteins with higher expression levels in ABC relative to GCB. D, expression patterns for a cluster of proteins with higher expression levels in GCB relative to ABC.
Fig. 4.
Fig. 4.
Principal component analysis. A, the proteomes of 10 DLBCL cell lines measured in triplicate segregated into ABC-DLBCL and GCB-DLBCL subtypes after filtering for 100% valid values (3,007 proteins). B, loadings of A reveal proteins that strongly drive the segregation in PCA component 1. C, the same analysis as in A but after filtering for 50% valid values (4,991 proteins) and filling the missing values by data imputation results in even stronger separation. D, loadings of C uncover additional known and unknown markers that segregate the ABC and GCB subtypes.
Fig. 5.
Fig. 5.
Category-based analysis of subtype differences. A, PCA of 10 lymphoma cell lines after filtering for proteins annotated by KEGG to be involved in cancer (KEGG category: pathways in cancer). B, loadings of PCA in A.
Fig. 6.
Fig. 6.
t test signature. A, t test analysis of the proteins from the two groups of cell lines resulted in a signature of 55 proteins that are most significantly different. The panel depicts a heat map of the ratios of these proteins after clustering. B, plot of the difference of mean ratios versus the significance of signature proteins. The proteins on the left are significantly up-regulated in the ABC relative to GCB subtype. The protein names highlighted in red indicate NF-κB regulated genes.
Fig. 7.
Fig. 7.
Single-shot proteome measurements to distinguish ABC from GCB. A, unfractionated, FASP-processed peptide mixtures were directly loaded onto a relatively long column (50 cm) after StageTipping. The proteomes were analyzed in triplicates in 4-h runs by an UHPLC (EASY nLC 1000) system coupled to a benchtop quadrupole Orbitrap mass spectrometer (Q Exactive). B, principal component analysis of the single-shot measurements. C, loadings of PCA in B highlighting the proteins that strongly drive the segregation in PCA component 1.

Similar articles

Cited by

References

    1. Quackenbush J. (2006) Microarray Analysis and Tumor Classification. New Engl. J. Med. 354, 2463–2472 - PubMed
    1. McDermott U., Downing J. R., Stratton M. R. (2011) Genomics and the Continuum of Cancer Care. New Engl. J. Med. 364, 340–350 - PubMed
    1. Hanash S., Taguchi A. (2010) The grand challenge to decipher the cancer proteome. Nat. Rev. Cancer 10, 652–660 - PubMed
    1. Choudhary C., Mann M. (2010) Decoding signalling networks by mass spectrometry-based proteomics. Nat. Rev. Mol. Cell Biol. 11, 427–439 - PubMed
    1. Aebersold R., Mann M. (2003) Mass spectrometry-based proteomics. Nature 422, 198–207 - PubMed

Publication types