. 2012 Jul;11(7):M111.013482.
doi: 10.1074/mcp.M111.013482. Epub 2012 Mar 22.

Intercellular variation in signaling through the TGF-β pathway and its relation to cell density and cell cycle phase

Affiliations

Intercellular variation in signaling through the TGF-β pathway and its relation to cell density and cell cycle phase

Agata Zieba et al. Mol Cell Proteomics. 2012 Jul.

Abstract

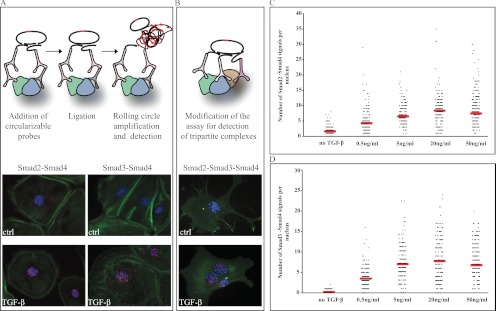
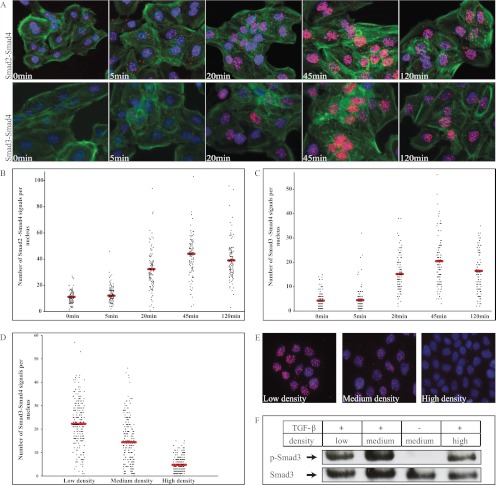
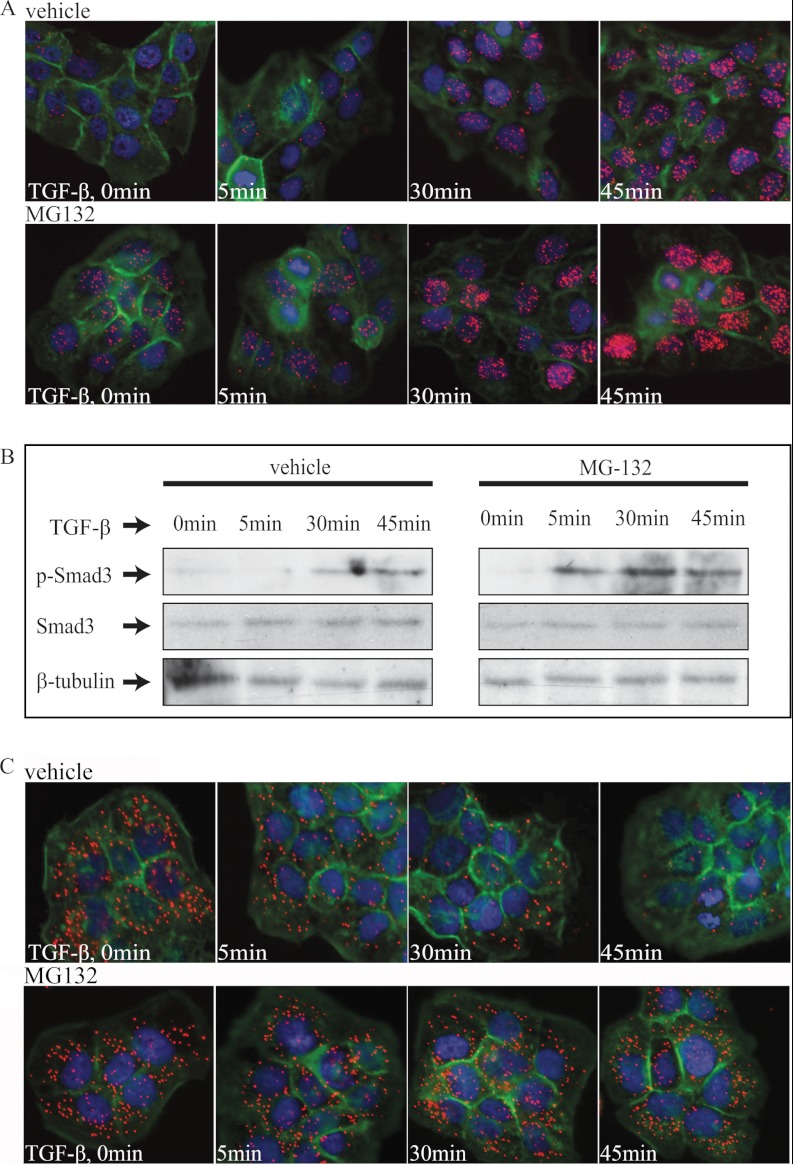
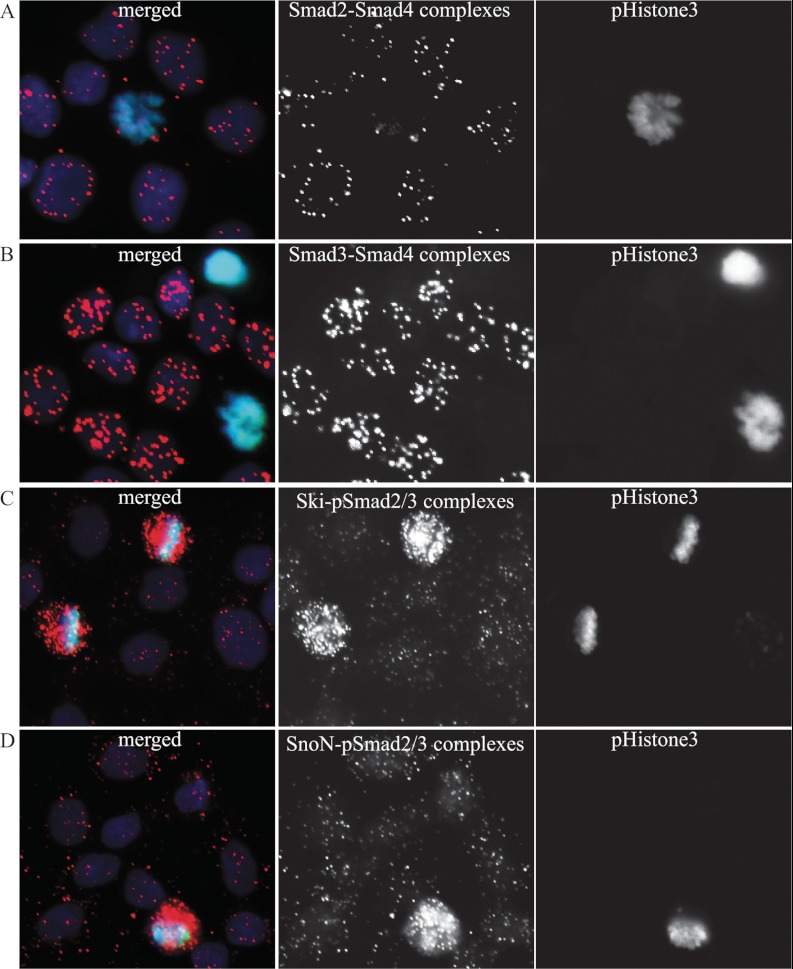
Fundamental open questions in signal transduction remain concerning the sequence and distribution of molecular signaling events among individual cells. In this work, we have characterized the intercellular variability of transforming growth factor β-induced Smad interactions, providing essential information about TGF-β signaling and its dependence on the density of cell populations and the cell cycle phase. By employing the recently developed in situ proximity ligation assay, we investigated the dynamics of interactions and modifications of Smad proteins and their partners under native and physiological conditions. We analyzed the kinetics of assembly of Smad complexes and the influence of cellular environment and relation to mitosis. We report rapid kinetics of formation of Smad complexes, including native Smad2-Smad3-Smad4 trimeric complexes, in a manner influenced by the rate of proteasomal degradation of these proteins, and we found a striking cell to cell variation of signaling complexes. The single-cell analysis of TGF-β signaling in genetically unmodified cells revealed previously unknown aspects of regulation of this pathway, and it provided a basis for analysis of these signaling events to diagnose pathological perturbations in patient samples and to evaluate their susceptibility to drug treatment.


Figures

Fig. 1.
Fig. 1.
Detection of Smad2, Smad3, and Smad4 complexes in cultured cells. Mouse embryonic fibroblasts were stimulated with TGF-β (10 ng/ml) for 45 min; thereafter, complexes between Smad2-Smad4 and Smad3-Smad4 proteins (A) or between Smad2, Smad3, and Smad4 proteins (B) were determined by the in situ PLA method. Forty-eight hours after seeding the cells, signaling through the TβRI was blocked by the kinase inhibitor GW6604 in HaCaT cells (no TGF-β), followed by treatment with different concentrations of TGF-β for 45 min, fixation, and incubation with antibodies against Smad2 and Smad4 (C) or Smad3 and Smad4 (D). Formation of complexes was visualized using hybridization probes labeled with Alexa 555 (orange). The cytoplasm was stained with Alexa 488-labeled phalloidin (green), and the nuclei were stained with Hoechst (blue). The RCA signals were quantified using the DuolinkImageTool software. Mean RCA values are indicated by red lines (C and D). ctrl, control.
Fig. 2.
Fig. 2.
Time course of TGF-β-induced Smad complexes. HaCaT cells were stimulated with TGF-β for 5, 20, 45, and 120 min. The number of nuclear Smad2-Smad4 complexes increased significantly during the first 20 min of incubation with 10 ng/ml TGF-β (A and B). A minor increase of complexes of Smad3-Smad4 was observed already after 5 min of stimulation with TGF-β (A and C). To investigate the effect of cell density on the number of Smad interactions, HaCaT cells were seeded at three densities (50 cells/104 μm2, 30 cells/104 μm2, and 15 cells/104 μm2), and formation of the Smad3-Smad4 complexes was analyzed using in situ PLA (D and E). The cells seeded at the same densities were used for immunoblot analysis of C-terminal phosphorylation (p-Smad3) and total levels of Smad3 (F). The red signals obtained with hybridization probes labeled with Alexa 555 (orange) represent interaction between Smad2 and Smad4 and between Smad3 and Smad4. For cytoplasmic and nuclear visualization, Alexa 488-labeled phalloidin (green) and Hoechst (blue), respectively, were used (A).
Fig. 3.
Fig. 3.
Effect of proteasomal inhibition on formation of Smad3-Smad4 complexes. A, HaCaT cells were pretreated for 2 h with GW6604 inhibitor (5 μm) to block basal TGF-β signaling and for 1 h with MG132 (25 μm) to inhibit proteasomal degradation of proteins prior to stimulation. MG132 was also present during stimulation with TGF-β for 5, 30, and 45 min. The Smad3-Smad4 complex formation was visualized using hybridization probes labeled with Alexa 555 (orange). The cytoplasm was stained with FITC Alexa 488-labeled phalloidin (green), and the nuclei were stained with Hoechst (blue). Analysis by immunoblotting revealed an enhanced C-terminal phosphorylation of Smad3 (P-Smad3) upon stimulation with TGF-β in the presence of MG132 in comparison with control (vehicle). B, the level of total Smad3 and α-tubulin remained constant at all time points. HaCaT cells were pretreated for 2 h with GW6604 inhibitor (5 μm) and for 1 h with MG132 (25 μm) and then stimulated with TGF-β at a concentration of 10 ng/ml. C, C-terminally phosphorylated Smad2/3 and Ski complexes were visualized by in situ PLA.
Fig. 4.
Fig. 4.
R-Smad-Smad4 complexes are excluded while R-Smad-Ski/SnoN complexes accumulate in mitotic cells. HaCaT cells were seeded 40 h before treatment with the TGF-β type I receptor inhibitor GW6604. Smad2-Smad4 (A), Smad3-Smad4 (B), C-terminally phosphorylated Smad2/3-Ski (C), and C-terminally phosphorylated Smad2/3-SnoN (D) complexes were visualized by in situ PLA, followed by phospho-histone 3 immunofluorescence to mark mitotic cells. Mitotic cells showed no evidence of Smad complexes in their nuclei or cytoplasm. The cells in interphase showed robust nuclear Smad complexes. Conversely, mitotic cells showed strong accumulation of nuclear pSmad2/3-Ski/SnoN complexes, whereas cells in interphase lacked the latter complexes. The nuclei were stained with Hoechst (blue), and p-histone3 was detected with Alexa 488-labeled anti-p-histone3 antibody (green). The complex formation was visualized using hybridization probes labeled with Alexa 555 (orange).
Fig. 5.
Fig. 5.
Detection of Smad2, Smad3, and Smad4 complexes in human tissue samples. The presence of Smad2-Smad4 (A, C, and E) and Smad3-Smad4 (B, D, and F) complexes were analyzed in normal mucosal epithelial cells of colon tissue obtained from healthy individuals (A and B), from the adenoma adenomatous part of colorectal cancer (C and D), and in invasive adenocarcinoma (E and F). The cytoplasm was stained with FITC Alexa 488-labeled phalloidin (green), and the nuclei were stained with Hoechst (blue).

References

    1. Massagué J., Blain S. W., Lo R. S. (2000) TGFβ signaling in growth control, cancer, and heritable disorders. Cell 103, 295–309 - PubMed
    1. Moustakas A., Heldin C. H. (2009) The regulation of TGFβ signal transduction. Development 136, 3699–3714 - PubMed
    1. Massagué J., Wotton D. (2000) Transcriptional control by the TGF-β/Smad signaling system. EMBO J. 19, 1745–1754 - PMC - PubMed
    1. Abdollah S., Macías-Silva M., Tsukazaki T., Hayashi H., Attisano L., Wrana J. L. (1997) TβRI phosphorylation of Smad2 on Ser465 and Ser467 is required for Smad2-Smad4 complex formation and signaling. J. Biol. Chem. 272, 27678–27685 - PubMed
    1. Akiyoshi S., Inoue H., Hanai J., Kusanagi K., Nemoto N., Miyazono K., Kawabata M. (1999) c-Ski acts as a transcriptional co-repressor in transforming growth factor-β signaling through interaction with smads. J. Biol. Chem. 274, 35269–35277 - PubMed

Publication types

MeSH terms