. 2012 Apr;61(4):818-27.
doi: 10.2337/db11-1293.

Islet β-cell endoplasmic reticulum stress precedes the onset of type 1 diabetes in the nonobese diabetic mouse model

Affiliations

Islet β-cell endoplasmic reticulum stress precedes the onset of type 1 diabetes in the nonobese diabetic mouse model

Sarah A Tersey et al. Diabetes. 2012 Apr.

Abstract

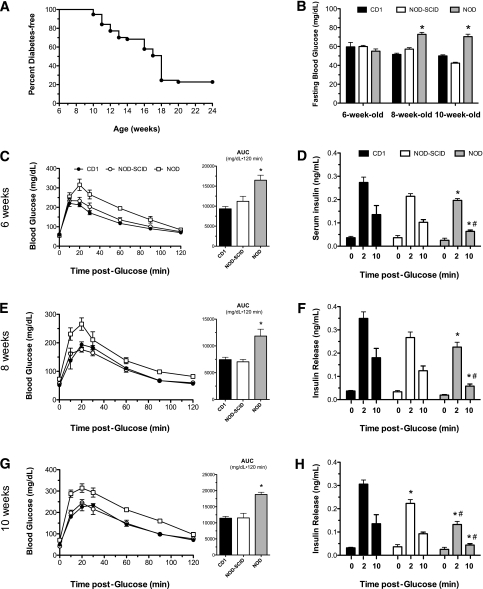
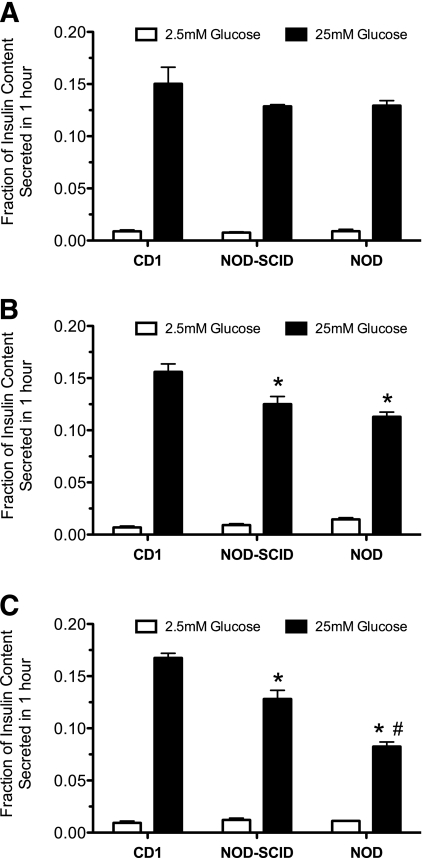
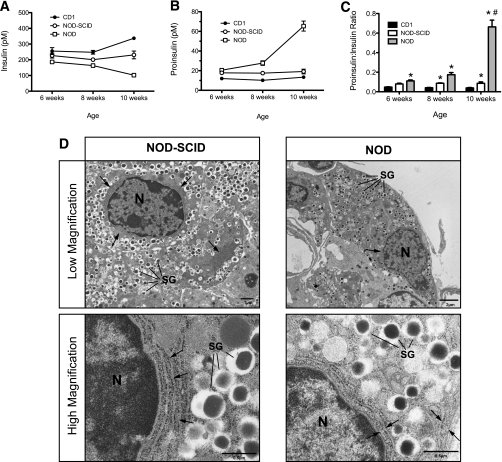
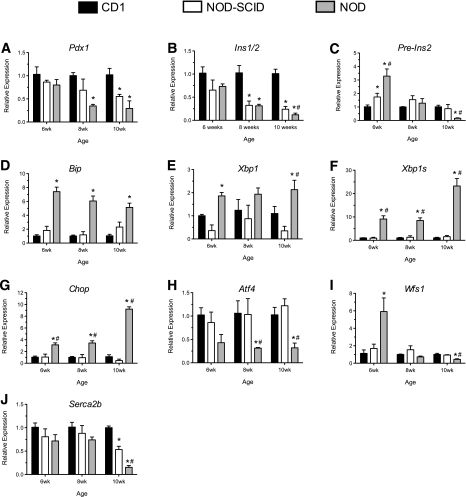
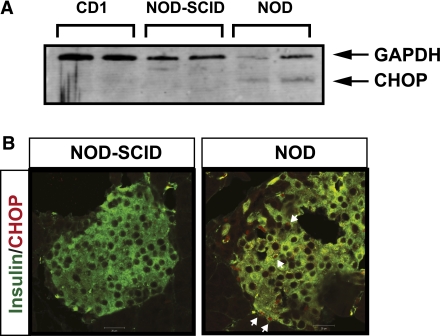
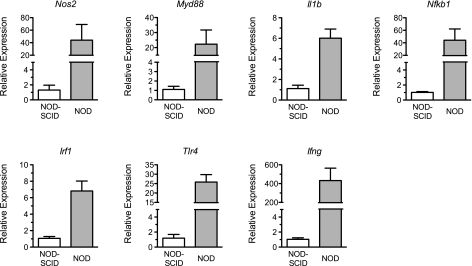
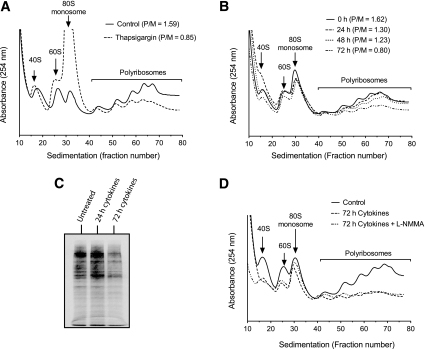
Type 1 diabetes is preceded by islet β-cell dysfunction, but the mechanisms leading to β-cell dysfunction have not been rigorously studied. Because immune cell infiltration occurs prior to overt diabetes, we hypothesized that activation of inflammatory cascades and appearance of endoplasmic reticulum (ER) stress in β-cells contributes to insulin secretory defects. Prediabetic nonobese diabetic (NOD) mice and control diabetes-resistant NOD-SCID and CD1 strains were studied for metabolic control and islet function and gene regulation. Prediabetic NOD mice were relatively glucose intolerant and had defective insulin secretion with elevated proinsulin:insulin ratios compared with control strains. Isolated islets from NOD mice displayed age-dependent increases in parameters of ER stress, morphologic alterations in ER structure by electron microscopy, and activation of nuclear factor-κB (NF-κB) target genes. Upon exposure to a mixture of proinflammatory cytokines that mimics the microenvironment of type 1 diabetes, MIN6 β-cells displayed evidence for polyribosomal runoff, a finding consistent with the translational initiation blockade characteristic of ER stress. We conclude that β-cells of prediabetic NOD mice display dysfunction and overt ER stress that may be driven by NF-κB signaling, and strategies that attenuate pathways leading to ER stress may preserve β-cell function in type 1 diabetes.


Figures

FIG. 1.
FIG. 1.
Glucose homeostasis in female CD1, NOD-SCID, and prediabetic NOD mice. A: Diabetes incidence in female NOD mice by age. Diabetes was defined as blood glucose >300 mg/dL on two consecutive measurements. n = 57 mice. B: Blood glucose values, as measured following an overnight fast in 6-, 8-, and 10-week-old mice. C, E, and G: Results of glucose tolerance tests and their corresponding area under the curve (AUC) analyses in mice at 6 (C), 8 (E), and 10 (G) weeks of age following intraperitoneal injections of glucose (2 mg/kg). n = 5–6 mice per group. D, F, and H: Serum insulin values in mice at 6 (D), 8 (F), and 10 (H) weeks of age at the indicated times following an intraperitoneal injection of glucose (2 g/kg). n = 3–4 mice per group. *P < 0.05 compared with the corresponding time value for CD1 mice. #P < 0.05 compared with the corresponding time value for NOD-SCID mice.
FIG. 2.
FIG. 2.
GSIS from islets of female CD1, NOD-SCID, and prediabetic NOD mice. Shown are results of GSIS studies from islets of female CD1, NOD-SCID, and prediabetic NOD mice at 6 (A), 8 (B), and 10 (C) weeks of age exposed to low (2.5 mmol/L) and high (25 mmol/L) glucose concentrations. n = 3 independent, pooled islet isolations per group. *P < 0.05 compared with the corresponding glucose value for CD1 mice. #P < 0.05 compared with the corresponding glucose value for NOD-SCID mice.
FIG. 3.
FIG. 3.
Secreted hormone levels and electron microscopic imaging of female prediabetic mice. A: Insulin levels in nonfasting 6-, 8-, and 10-week-old female CD1, NOD-SCID, and prediabetic NOD mice. B: Proinsulin levels in nonfasting 6-, 8-, and 10-week-old CD1, NOD-SCID, and prediabetic NOD mice. C: Proinsulin:insulin ratios in nonfasting 6-, 8-, and 10-week-old CD1, NOD-SCID, and prediabetic NOD mice. D: Representative low- and high-magnification transmission electron microscopic images of β-cells from 10-week-old NOD-SCID and prediabetic NOD mice. Arrows indicate ER. N, nucleus; SG, secretory granule. n = 4–5 mice in panels AC. *P < 0.05 compared with the corresponding value for CD1 mice. #P < 0.05 compared with the corresponding value for NOD-SCID mice.
FIG. 4.
FIG. 4.
Transcript levels of ER stress–responsive genes in islets of female CD1, NOD-SCID, and prediabetic NOD mice. Islets from 6-, 8-, and 10-week-old female CD1, NOD-SCID, and prediabetic NOD mice were isolated and processed for total RNA. Total RNA from each age and strain was then subjected to quantitative real-time RT-PCR for selected genes; the values were corrected for Actb mRNA levels and are displayed relative to 6-week-old CD1 islet data. Shown are results for Pdx1 (A), Ins1/2 (B), pre-Ins2 (C), Bip (D), Xbp1 (E), Xbp1s (F), Chop (G), Atf4 (H), Wfs1 (I), and Serca2b (J). n = 3 independent, pooled islet isolations per group. *P < 0.05 compared with the corresponding value for CD1 mice. #P < 0.05 compared with the corresponding value for NOD-SCID mice.
FIG. 5.
FIG. 5.
CHOP expression in islets and pancreata of prediabetic NOD mice. A: Results of immunoblot analysis for glyceraldehyde-3-phosphate dehydrogenase (GAPDH) and CHOP from islet extracts from each of two 10-week-old female CD1, NOD-SCID, and prediabetic NOD mice. B: Fixed pancreatic sections from 10-week-old female NOD-SCID and prediabetic NOD mice were subjected to immunofluorescence staining for insulin (green) and CHOP (red). Shown are representative islets from each strain. Arrows in the right panel identify CHOP+/insulin+ cells. (A high-quality digital representation of this figure is available in the online issue.)
FIG. 6.
FIG. 6.
Transcript levels of NF-κB target genes in islets of female NOD-SCID and prediabetic NOD mice. Islets from 10-week-old female NOD-SCID and prediabetic NOD mice were isolated and processed for total RNA. Total RNA from each strain was then subjected to quantitative real-time RT-PCR for the NF-κB target genes shown at the top of each panel; the values were corrected for Actb mRNA levels and are displayed relative to NOD-SCID islet data. n = 3 independent, pooled islet isolations per group.
FIG. 7.
FIG. 7.
Translational profiling of MIN6 cells. MIN6 cells were incubated with thapsigargin for 6 h or cytokines for the indicated times, then cellular extracts were harvested and subjected to centrifugation through a 10–50% sucrose gradient. Profiles through the gradient were measured by absorbance at 254 nm. A: Profiles of MIN6 cells untreated or exposed to thapsigargin. Positions of the 40S and 60S subunits, 80S monosome, and polyribosomes are indicated, and the P/M ratios are shown (as calculated from areas under the respective curves). B: Profiles of MIN6 cells untreated or exposed to a mixture of cytokines (IL-1β, TNF-α, and IFN-γ) for the indicated times are shown, as are the respective P/M ratios. C: Results of SDS-PAGE analysis of 35S-labeled protein in MIN6 cells that were untreated or exposed to cytokines for the indicated times. D: Profiles of MIN6 cells untreated and exposed to a mixture of cytokines or to a mixture of cytokines + 100 μmol/L l-NMMA. All data shown are from representative experiments performed on 2–3 occasions.

Comment in

References

    1. Charré S, Rosmalen JG, Pelegri C, et al. Abnormalities in dendritic cell and macrophage accumulation in the pancreas of nonobese diabetic (NOD) mice during the early neonatal period. Histol Histopathol 2002;17:393–401 - PubMed
    1. McDuffie M, Maybee NA, Keller SR, et al. Nonobese diabetic (NOD) mice congenic for a targeted deletion of 12/15-lipoxygenase are protected from autoimmune diabetes. Diabetes 2008;57:199–208 - PMC - PubMed
    1. Lehuen A, Diana J, Zaccone P, Cooke A. Immune cell crosstalk in type 1 diabetes. Nat Rev Immunol 2010;10:501–513 - PubMed
    1. Atkinson MA, Bluestone JA, Eisenbarth GS, et al. How does type 1 diabetes develop?: the notion of homicide or β-cell suicide revisited. Diabetes 2011;60:1370–1379 - PMC - PubMed
    1. Strandell E, Eizirik DL, Sandler S. Reversal of beta-cell suppression in vitro in pancreatic islets isolated from nonobese diabetic mice during the phase preceding insulin-dependent diabetes mellitus. J Clin Invest 1990;85:1944–1950 - PMC - PubMed

Publication types