

T-DNA insertion mutants reveal complex expression patterns of the aldehyde dehydrogenase 3H1 locus in Arabidopsis thaliana
- PMID: 22442412
- PMCID: PMC3388822
- DOI: 10.1093/jxb/ers081
T-DNA insertion mutants reveal complex expression patterns of the aldehyde dehydrogenase 3H1 locus in Arabidopsis thaliana
Abstract
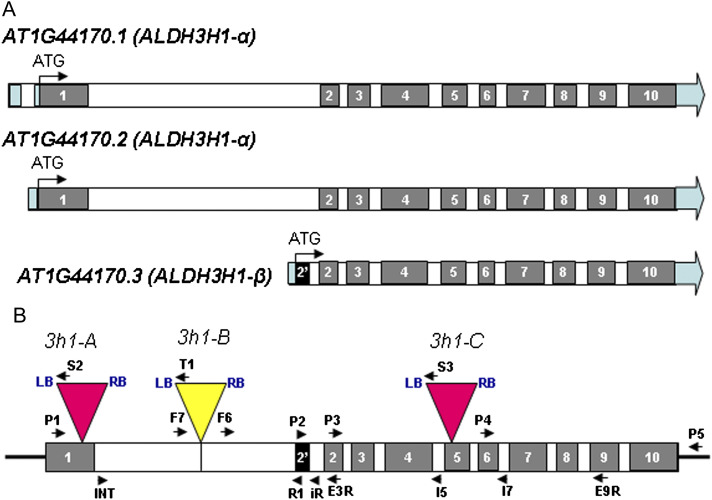
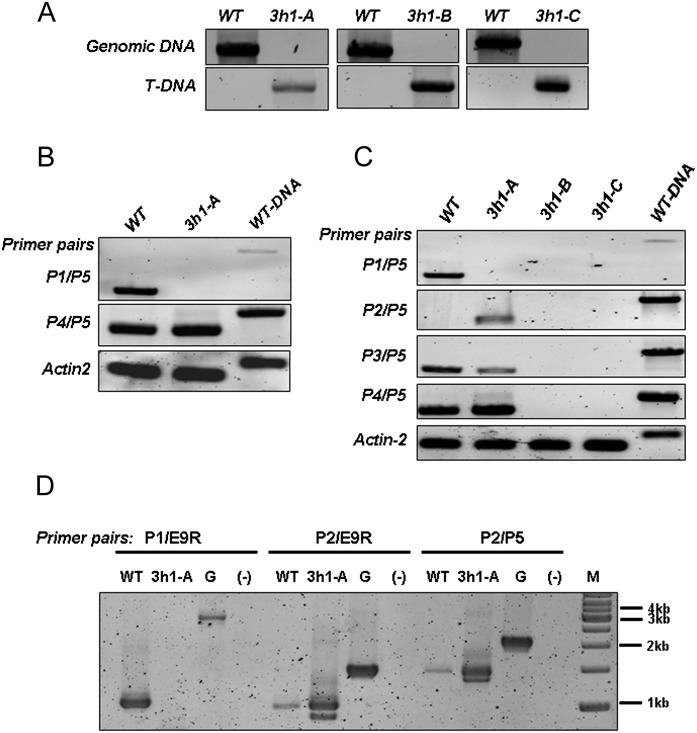
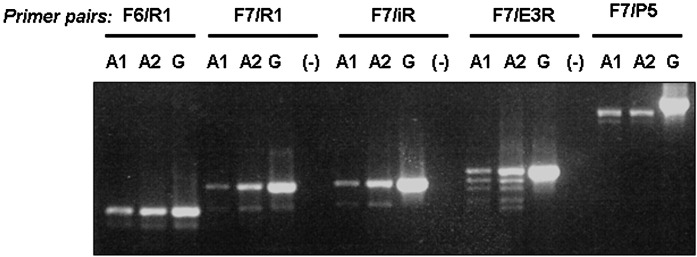
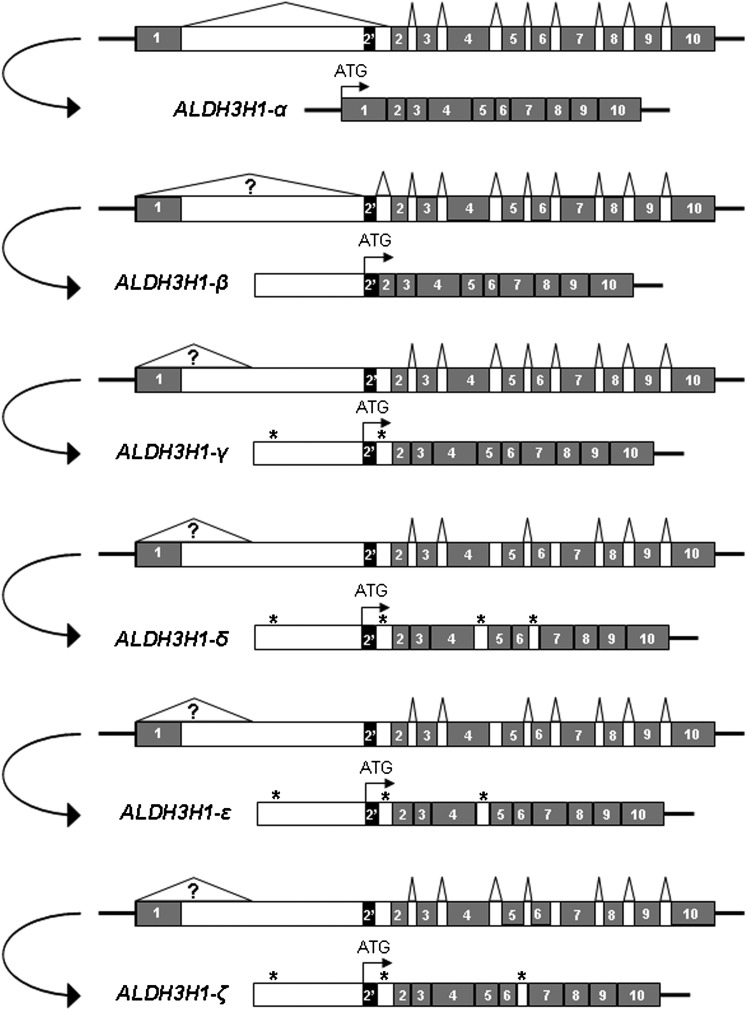
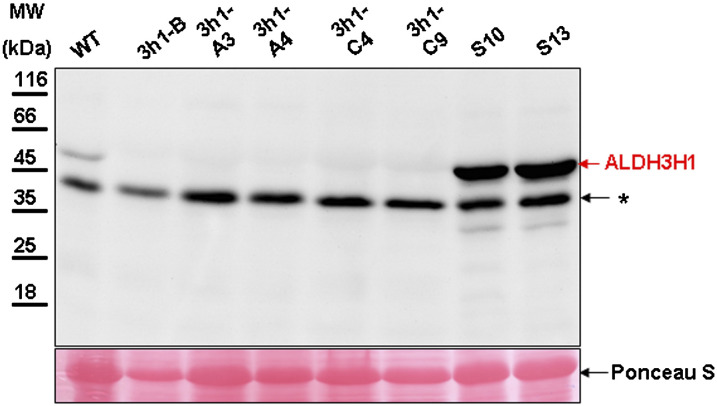
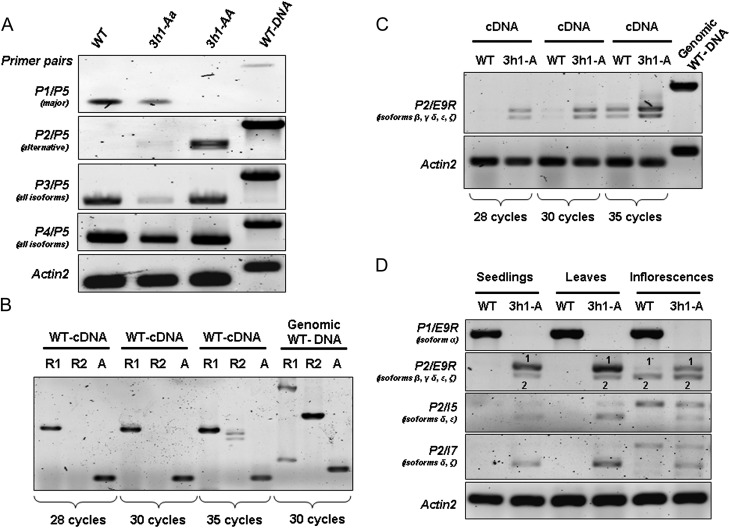
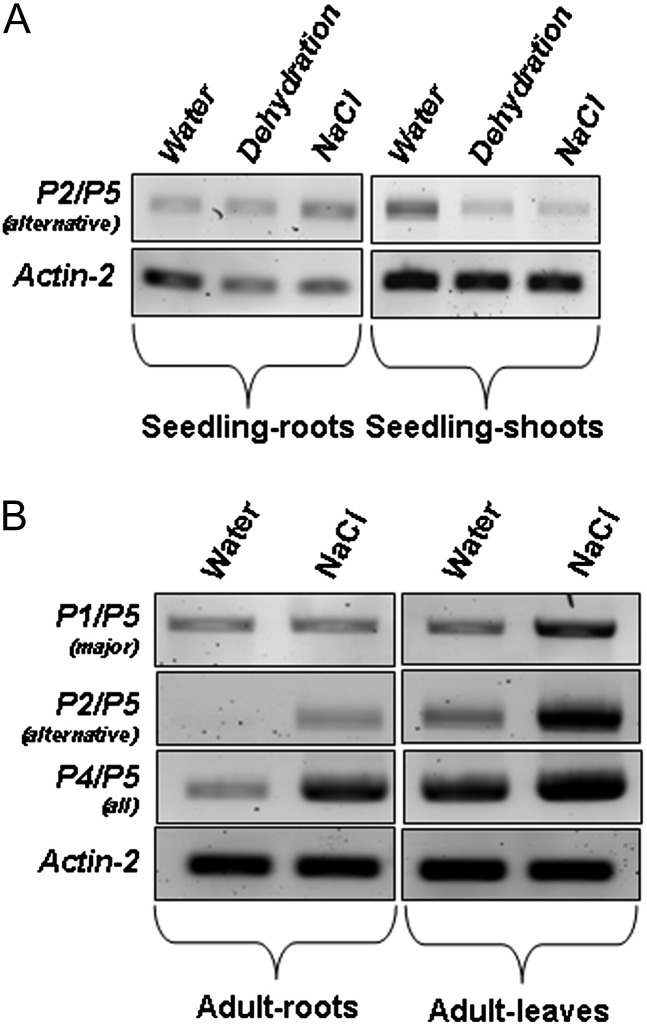
The Arabidopsis thaliana aldehyde dehydrogenase 3H1 gene (ALDH3H1; AT1G44170) belongs to family 3 of the plant aldehyde dehydrogenase superfamily. The full-length transcript of the corresponding gene comprises an open reading frame of 1583 bp and encodes a protein of 484 amino acid residues. Gene expression studies have shown that this transcript accumulates mainly in the roots of 4-week-old plants following abscisic acid, dehydration, and NaCl treatments. The current study provided experimental data that the ALDH3H1 locus generates at least five alternative transcript variants in addition to the previously described ALDH3H1 mRNA. The alternative transcripts accumulated in wild-type plants at a low level but were upregulated in a mutant that carried a T-DNA insertion in the first exon of the gene. Expression of the transcript isoforms involved alternative gene splicing combined with an alternative promoter. The transcript isoforms were differentially expressed in the roots and shoots and showed developmental stage- and tissue-specific expression patterns. These data support the hypothesis that alternative isoforms produced by gene splicing or alternative promoters regulate the abundance of the constitutively spliced and functional variants.
Figures
Similar articles
-
Sequence and functional analyses of the aldehyde dehydrogenase 7B4 gene promoter in Arabidopsis thaliana and selected Brassicaceae: regulation patterns in response to wounding and osmotic stress.Planta. 2014 Jun;239(6):1281-98. doi: 10.1007/s00425-014-2051-0. Epub 2014 Mar 12. Planta. 2014. PMID: 24619504
-
Detailed expression analysis of selected genes of the aldehyde dehydrogenase (ALDH) gene superfamily in Arabidopsis thaliana.Plant Mol Biol. 2005 Feb;57(3):315-32. doi: 10.1007/s11103-004-7796-6. Plant Mol Biol. 2005. PMID: 15830124
-
OSM1/SYP61: a syntaxin protein in Arabidopsis controls abscisic acid-mediated and non-abscisic acid-mediated responses to abiotic stress.Plant Cell. 2002 Dec;14(12):3009-28. doi: 10.1105/tpc.006981. Plant Cell. 2002. PMID: 12468724 Free PMC article.
-
A homolog of splicing factor SF1 is essential for development and is involved in the alternative splicing of pre-mRNA in Arabidopsis thaliana.Plant J. 2014 May;78(4):591-603. doi: 10.1111/tpj.12491. Epub 2014 Apr 23. Plant J. 2014. PMID: 24580679
-
Arabidopsis thaliana thymidine kinase 1a is ubiquitously expressed during development and contributes to confer tolerance to genotoxic stress.Plant Mol Biol. 2015 Feb;87(3):303-15. doi: 10.1007/s11103-014-0277-7. Epub 2014 Dec 24. Plant Mol Biol. 2015. PMID: 25537647
Cited by
-
Aldehyde Dehydrogenases Function in the Homeostasis of Pyridine Nucleotides in Arabidopsis thaliana.Sci Rep. 2018 Feb 13;8(1):2936. doi: 10.1038/s41598-018-21202-6. Sci Rep. 2018. PMID: 29440669 Free PMC article.
-
Arabidopsis Motif Scanner.BMC Bioinformatics. 2016 Jan 27;17:50. doi: 10.1186/s12859-016-0896-x. BMC Bioinformatics. 2016. PMID: 26817596 Free PMC article.
-
The role of Arabidopsis aldehyde dehydrogenase genes in response to high temperature and stress combinations.J Exp Bot. 2017 Jul 10;68(15):4295-4308. doi: 10.1093/jxb/erx194. J Exp Bot. 2017. PMID: 28922758 Free PMC article.
-
Sequence and functional analyses of the aldehyde dehydrogenase 7B4 gene promoter in Arabidopsis thaliana and selected Brassicaceae: regulation patterns in response to wounding and osmotic stress.Planta. 2014 Jun;239(6):1281-98. doi: 10.1007/s00425-014-2051-0. Epub 2014 Mar 12. Planta. 2014. PMID: 24619504
-
The cell wall pectic polymer rhamnogalacturonan-II is required for proper pollen tube elongation: implications of a putative sialyltransferase-like protein.Ann Bot. 2014 Oct;114(6):1177-88. doi: 10.1093/aob/mcu093. Epub 2014 May 13. Ann Bot. 2014. PMID: 24825296 Free PMC article.
References
-
- Alexandrov NN, Troukhan ME, Brover VV, Tatarinova T, Lu Y-P, Flavell RB, Feldmann KA. Features of Arabidopsis genes and genome discovered using full-length cDNAs. Plant Molecular Biology. 2006;60:69–85. - PubMed
-
- An Y-Q, McDowell JM, Huang S, McKinney EC, Chambliss S, Meagher RB. Strong, constitutive expression of the Arabidopsis ACT2/ACT8 actin subclass in vegetative tissues. The Plant Journal. 1996;10:107–121. - PubMed
-
- Barbazuk WB, Fu Y, McGinnis KM. Genome-wide analyses of alternative splicing in plants: opportunities and challenges. Genome Research. 2008;18:1381–1392. - PubMed
-
- Baulcombe DC, Saunders GR, Bevan MW, Mayo MA, Harrison BD. Expression of biologically active viral satellite RNA from the nuclear genome of transformed plants. Nature. 1986;321:446–449.
Publication types
MeSH terms
Substances
LinkOut - more resources
Full Text Sources
Molecular Biology Databases
Research Materials
