. 2012 Apr 15;188(8):3686-99.
doi: 10.4049/jimmunol.1102594. Epub 2012 Mar 21.

Antigen recognition is facilitated by invadosome-like protrusions formed by memory/effector T cells

Affiliations

Antigen recognition is facilitated by invadosome-like protrusions formed by memory/effector T cells

Peter T Sage et al. J Immunol. .

Abstract

Adaptive immunity requires that T cells efficiently scan diverse cell surfaces to identify cognate Ag. However, the basic cellular mechanisms remain unclear. In this study, we investigated this process using vascular endothelial cells, APCs that possess a unique and extremely advantageous, planar morphology. High-resolution imaging revealed that CD4 memory/effector T cells dynamically probe the endothelium by extending submicron-scale, actin-rich "invadosome/podosome-like protrusions" (ILPs). The intimate intercellular contacts enforced by ILPs consistently preceded and supported T cell activation in response to endothelial MHC class II/Ag. The resulting calcium flux stabilized dense arrays of ILPs (each enriched in TCR, protein kinase C-θ, ZAP70, phosphotyrosine, and HS1), forming what we term a podo-synapse. Similar findings were made using CD8 CTLs on endothelium. Furthermore, careful re-examination of both traditional APC models and professional APCs suggests broad relevance for ILPs in facilitating Ag recognition. Together, our results indicate that ILPs function as sensory organelles that serve as actuators of immune surveillance.


Figures

Fig. 1
Fig. 1. Human Microvascular ECs are Capable of Ag-specific Stimulation of CD4 Memory-like T Cells
(A) Human CD4 nTmem (circles) or iTmem (triangles) were loaded with Fura-2 and incubated on Ag-pulsed HLMVECs. Calcium flux at 5 min (left) or at maximal value over a 30 min duration (right) were plotted. (B and C) iTmem were incubated on HLMVEC pulsed with Ag and T cell polarity (length/width ratio) at 5 min and velocity was calculated over a 30 min duration. (D) iTmem transendothelial migration was scored on Ag pulsed ECs as described in Materials and Methods. (E) iTmem were infused over Ag pulsed HLMVEC at 2 dyne/cm2 and imaged. Depicted is an end-point image with migration tracks of apical (blue) and transmigrated (red) lymphocytes. See also Video 1. (F and G) Lateral migration velocities for T cells from (E) during both pre- and post-diapedesis phases of migration over 30 min (F) and percent of iTmem transmigrated was measured (G). (H) Representative images of nTmem incubated on Ag-pulsed HLMVEC and staining for actin (green), NFAT (red) and nucleus (blue). (I) nTmem were incubated on activated HLMVEC. Nuclear NFAT translocation was scored according to line scan profiles (left). (J) Samples were acquired as in (H) and representative transmigrating or transmigrated (‘Under’) lymphocytes are shown. Scale bar = 5 μm. Data represent mean ± SD (B, C) or SEM (D, F, G, I). *p<0.05, **p<.005, ***p<0.0005.
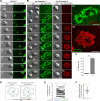
Fig. 2
Fig. 2. CD4 Memory-like T cells form Stabilized Arrays of ILPs on Ag-Presenting Endothelium
(A and B) HLMVECs were transfected with mem-YFP or mem-DsRed, activated and pulsed without (A) or with (B) Ag (TSST/SEB). iTmem were imaged live upon addition to ECs. Individual frames at selected time intervals are shown. Arrows indicate fluorescent rings formed on endothelium under adherent lymphocytes. The corresponding control (A) and Ag (B1 and B2) videos are provided as Supplemental Videos 2-4, respectively. (C) Podo-print/ILP lifetimes from imaging studies as in (A and B). Data represents mean ± SEM of at least 80 ILPs formed by at least 25 cells from three or more separate experiments. (D) Schematic representation of podo-print/ILP lateral translocation analysis. Grey ‘T cell outline’ represents a T cell-EC contact area with the ‘T cell centroid’ indicated as a blue circle and individual podo-prints indicated as black rings. The linear distance between the centroid and podo-print was measured at both the first and last appearance of an individual podo-print/ILP during its lifetime. (E and F) Podo-print/ILP distances were measured as in (D). Distances from the cell centroid at time of formation and disappearance were plotted for individual podo-prints (E). Data from (E) was further processed to report change in distance (F). Scale bars= 5 μm.
Fig. 3
Fig. 3. Ag-Stabilized ILPs Exhibit a Discrete 3D Architecture
(A) Ag-stabilized T cell ILPs protude into the EC surface. Imaging was conducted as in (Fig. 2B) on HLMVECs co-expressing soluble, cytoplasmic GFP (green) and mem-DsRed (red). (B) 3D reconstruction from confocal imaging of podo-prints and ILPs. iTmem were incubated for 20 min on activated Ag-pulsed (SEE) HUVEC and then fixed, stained for ICAM-1 (green) and LFA-1(red) and imaged by confocal microscopy. Sections were digitally reconstructed and projected as 3D renderings. Inset (b) provides a magnified view of the ILP arrays. Inset (b’) provides an orthogonal cross-section. See also Video 5. (C and D) Ag-stabilized ILPs are enriched in actin and talin. Mem-YFP(C; green)- or mem-DsRed(D; red)-transfected HLMVEC were pulsed with Ag (TSST/SEB) and incubated with iTmem for 5 min and stained for F-actin (C; red) or talin (D; green). (E) Quantitation of ultrastructural depth and width of T cell ILPs. Samples as in (C) were imaged by electron microscopy and ILPs were measured. Data represent mean ± SEM from at least 100 ILPs from at least 20 representative micrographs per condition. (F and G) ILPs enforce close T cell-EC membrane apposition in the absence and presence of Ag. T cell and endothelial nuclei are indicated with red and green overlays, respectively. Arrows and inset (a) highlight regions of extremely close lymphocyte-EC membrane apposition enforced at the ILP tips. Scale bars in A-D represent 5 μm and in F-G represent 500 nm. Ns = not significant, *p<0.05.
Fig. 4
Fig. 4. Ag-Stabilized ILPs are Foci for Immune Signaling
ITmem cells were incubated with activated, Ag-pulsed (TSST/SEB) HLMVEC for 5 min, fixed, and stained as indicated and imaged by confocal microscopy. (A) Ag stabilized ILPs (F-actin, green) protrude into MHC-II (red)-enriched podo-prints. Arrows indicate MHC-II-enriched podo-prints. (B) Samples as in (A) were stained for MHC-II (HLA DR/DP/DQ; red) and MHC-I (HLA A/B/C; green). Schematic of gated regions of interest is shown on the left, and included a region outside of the IS (I), the ILP-rich region of the IS (II) and the central region of the IS (III). Right panels show pixel fluorescence intensity histograms for regions I-III. (C) ILPs (F-actin, blue) protruding into podo-prints (mem-YFP, green) are enriched in CD3 (red). Within individual ILPs CD3 is predominantly focused at the tip (insets b1) and to a lesser extent the edge (inset b2). (D) PKC-θ (red) is enriched with CD3 (green) in ILPs. (E-G) ILPs (F-actin, blue) colocalize with ZAP-70 (E; red), phospho-tyrosine (F; red) and HS1 (G; red). (H) HS1 (red) is highly enriched in ILPs. Cross-sectional views from serial-section confocal microscopy are shown of a lymphocyte adherent the endothelium presenting Ag. See 3D rotation in Video S6. (I and J) ILP arrays were allowed to form as above with the additional presence of physiologic laminar fluid shear flow (2.0 dyne/cm2, arrow indicates direction). (I) MHC class II (red) and f-actin (green) are shown. (J) CD3 (red) and ICAM-1 (green) are shown. Scale bars = 5 μm.
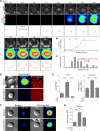
Fig. 5
Fig. 5. T Cell ILP Formation Precedes and Supports Efficient Ag Recognition
(A) ITmem were labeled with Fura-2 and imaged live (at a maximal temporal resolution of 10 seconds) during migration on mem-DsRed-transfected, Ag-pulsed HLMVECs. Upper panels show mem-DsRed. Arrows indicate initial ILP formation. Middle panels indicate calcium flux values on a rainbow scale. Lower panels provide a schematic representation of newly formed (green) and previously formed (in relation to previous field; red) podo-prints. ‘a’ is the frame of initial ILP/podoprint. ‘b’ is the frame when calcium flux rises above background. ‘c’ is the frame when the peripheral ILP array is stabilized. Note this correlates with peak calcium flux. See also Video S7. (B) Graphical representation of calcium flux with frames a-c noted. (C) Quantitation of ILP-calcium flux offset time. Live-cell imaging was as in (A) and offset time (time from when first ILP forms until calcium flux rises above background) was calculated. Data was binned into 10 second intervals and average +/- SEM is shown for 35 individual T cells from three separate experiments. Scale bars represent 5 μm. (D) Imaging was performed as in (A) with additional pretreatment of T cells with latrunculin-A before addition to Ag-pulsed EC monolayers. (E) Podo-print/ILP index (average number of podo-prints/ILPs per cell) and average calcium flux at 5 min was calculated. Both analyses are pooled mean ± SEM from from 3 separate experiments. (F) ITmem were labeled with Fluo-4 and imaged live with anti-CD3/CD28 cross-linking with or without latrunculin-A pretreatment. Left panels show resting T cells. Right panels show activated T cells imaged 60 seconds after addition of cross-linking antibodies. Arrows indicate de novo formation of micron-scale T cell protrusions. (G) Average calcium flux was calculated from three separate experiments as in (F). Scale bars represent 5 μm. Data represent mean ± SEM. ***p<0.0005.
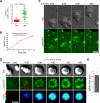
Fig. 6
Fig. 6. Calcium Flux is Necessary and Sufficient for ILP Stabilization
(A) ITmem were Fura-2 labelled, pretreated with the calcium chelator BAPTA and the CRAC channel inhibitor BTP-2 and imaged live on Ag pulsed ECs. Arrows indicate a few sporadically formed podo-prints. (B and C) Podo-print/ILP index (B) and average calcium flux (C) were calculated at 5 min for experiments as in (A). (D) Live cell imaging was conducted in the absence of Ag before and after addition of the calcium ionophore thapsigargin ( at time = ‘0:00’). Arrows indicate ILPs/podo-prints. (E) Correlation of calcium flux with ILP number after addition of thapsigargin. (F) Quantitation of the number of newly formed ILPs in the 2 minutes before and after addition of thapsigargin. (G) Quantitation of the lifetime of ILPs with or without addition of thapsigargin. (H and I) Imaging and analysis was performed as in A-C except T cells were pretreated with the CAMKII inhbitor CK59. Data represent mean ± SEM. **p<0.005. ***p<0.0005. Scale bars represent 5 μm.
Fig. 7
Fig. 7. Murine CD8 CTLs Use ILPs to Sense Ag Bound MHC-I on Endothelium
(A) Previously activated murine OTI CD8 T cells (CTLs) were imaged on mem-YFP-tranfected, mouse heart MVECs pulsed with SIINFEKL. Individual ratiometric calcium flux values at 5 min were plotted for -/+ Ag conditions. (B) CTLs were added to mixed cultures of Ag-pulsed/unpulsed ECs and percentage of specific lysis is plotted at indicated time points. (C) CTLs were imaged during EC probing in the absence of Ag. DIC and mem-YFP are shown in the upper and lower panels, respectively. Dashed line represents the outline of the migrating CTL under which transient ILPs are continuously formed. See also corresponding Video 8. (D) Imaging was conducted as in (C) on ECs pulsed with SIINFEKL. Red arrow indicates initial ILP formation preceding calcium flux. (E) Average offset time for calcium flux relative to initial ILP formation. Data represent mean ± SEM. Scale bars represent 5 μm.
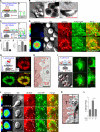
Fig. 8
Fig. 8. ILPs Facilitate Ag Recognition on Professional APCs
(A) Schematic of the ‘Coated-Glass Model’ using ICAM-1- and Ab-coated glass. Inset ‘b’ is a magnified view of the interaction surface. (B) iTmem were added to a ICAM-1-Fc- and anti-CD3-coated glass chamber and imaged by DIC and IRM. Arrows indicate IRM-detected ‘micro-contacts’. (C) Schematic of the ‘Planar Coated-Cell APC Model’. CHO-K1 cells expressing ICAM-1-GFP and soluble DsRed were surface ‘coated’ with Abs against CD3, CD43 or CD45 using a biotin/streptavidin capture approach (See also Fig. S4F). Inset ‘d’ is a magnified view of the interaction surface. (D) Cells prepared as in (C) coated with anti-CD3 antibody were imaged live upon addition of Fura-2-labeled iTmem. Panels demonstrate relatively early and later phases of interaction as indicated. Arrows indicate podo-prints/ILPs. See also Video 10. (E and F) Imaging experiments were conducted as in (D) but T cells were pretreated with latrunculin-A. Podo-print/ILP index (E) and calcium flux (F) were calculated. (G) ITmem were incubated with Ag-pulsed Priess B cells for 5 min and stained for LFA-1 and actin. Image represents a 3-D projection of T cell settled on top of the B cells with the IS forming more nearly parallel to the x-y imaging plane. See also Video 11. (H) Transmission electron micrograph of T cell-B cell IS as in (H). The T cell is identified by a red overlay. Arrows indicate close intercellular contacts formed by T cell ILPs. (I) Schematic (upper left panel) shows both lateral (a) and various ‘en face’ (b) interfaces typically formed in vitro between T cells and the highly irregular surfaces of DCs. Panels 1 and 2 show previously activated murine CD4 OT-II lymphocytes interacting with Ag-pulsed mem-YFP-transfected DCs (green, panel 2). Red outlines depict T cell perimeter based on DIC imaging (panel 1). Panel 3 is identical to panel 2 but shows three boxed regions (i-iii) expanded on the left. 3i shows a lateral interaction in which the T cell has pushed small finger-like invagination into the side of the BMDC putatively formed by ILPs (arrows). 3ii and 3iii show en face interactions whereby ILPs seem to be extending normal to the imaging plane giving rise to the typical ring shaped podo-print appearance observed in endothelium (i.e., Fig. 2). (J) DCs were transfected with sDsRed and mem-YFP, pulsed with Ag and CD4 OT-II T cells were added. Panels show cytoplasm displacing podo-prints/ILP (arrows) which precede calcium flux and are stabilized after calcium flux. (K) Transmission Electron Micrograph of T cell-DC IS as in (J) fixed after 5 min. The T cell is identified by a red overlay. Arrows indicate close intercellular contacts formed by T cell ILPs. (N) Calcium flux of previously activated CD4 OTII T cells 8 min after interaction with C57BL/6 (WT) or Ciita-/- Ag-pulsed DCs with or without latrunculin-A pretreatment. Data represent mean ± SEM. Scale bars = 5 μm.
Fig. 9
Fig. 9. Hypothetical Model for ILP Function in Ag Recognition and Response
Schematic depicts top-down and side views of a memory/effector T cell interacting with an APC/target cell. Lymphocytes initiate lateral migration (Step 1) and begin to dynamically drive ILPs against the apposing cell (Step 2, inset 2a). Close interactions between T and APC/target cells, which are partially opposed by the cell glycocalyces (inset 2b), form preferentially (but not exclusively) at ILP tips (insets 2c). We hypothesize that TCR/MHC interactions may be facilitated in these zones. Initial calcium released upon Ag recognition (green overlay/arrows; Step 3) seems to be coupled to stabilization/accumulation of ILP arrays (‘podo-synapses’; Step 4), which we hypothesize could in turn help sustain/enhance signaling (Step 5).

References

    1. von Andrian UH, Mackay CR. T-cell function and migration. Two sides of the same coin. N. Engl. J. Med. 2000;343:1020–1034. - PubMed
    1. Rudolph MG, Stanfield RL, Wilson IA. How TCRs bind MHCs, peptides, and coreceptors. Annual review of immunology. 2006;24:419–466. - PubMed
    1. Weinbaum S, Tarbell JM, Damiano ER. The structure and function of the endothelial glycocalyx layer. Annual review of biomedical engineering. 2007;9:121–167. - PubMed
    1. Bell GI, Dembo M, Bongrand P. Cell adhesion. Competition between nonspecific repulsion and specific bonding. Biophysical journal. 1984;45:1051–1064. - PMC - PubMed
    1. Springer TA. Adhesion receptors of the immune system. Nature. 1990;346:425–434. - PubMed

Publication types

MeSH terms