. 2012 Mar 23;10(1):21.
doi: 10.1186/1477-5956-10-21.

Proteomic analysis of effluents from perfused human heart for transplantation: identification of potential biomarkers for ischemic heart damage

Affiliations

Proteomic analysis of effluents from perfused human heart for transplantation: identification of potential biomarkers for ischemic heart damage

Hong Li et al. Proteome Sci. .

Abstract

Background: Biomarkers released from the heart at early stage of ischemia are very important to diagnosis of ischemic heart disease and salvage myocytes from death. Known specific markers for blood tests including CK-MB, cardiac troponin T (cTnT) and cardiac troponin I (cTnI) are released after the onset of significant necrosis instead of early ischemia. Thus, they are not good biomarkers to diagnose myocardial injury before necrosis happens. Therefore, in this study, we performed proteomic analysis on effluents from perfused human hearts of donors at different ischemic time.

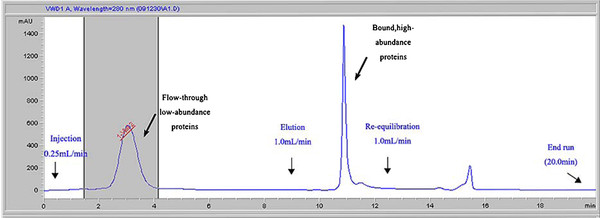
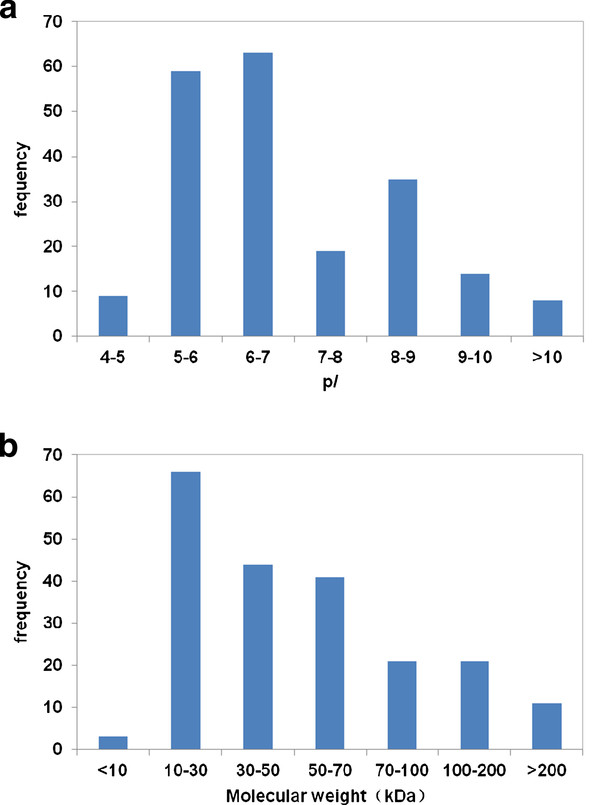
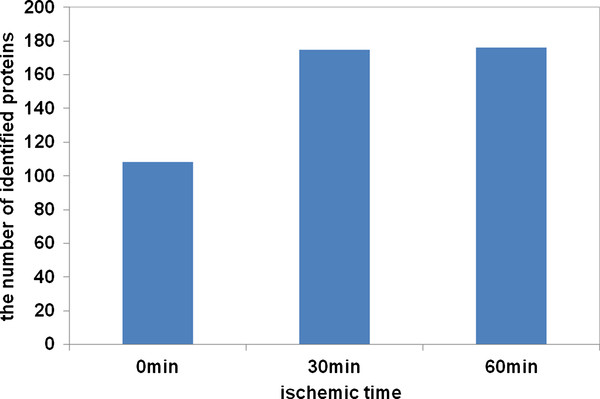
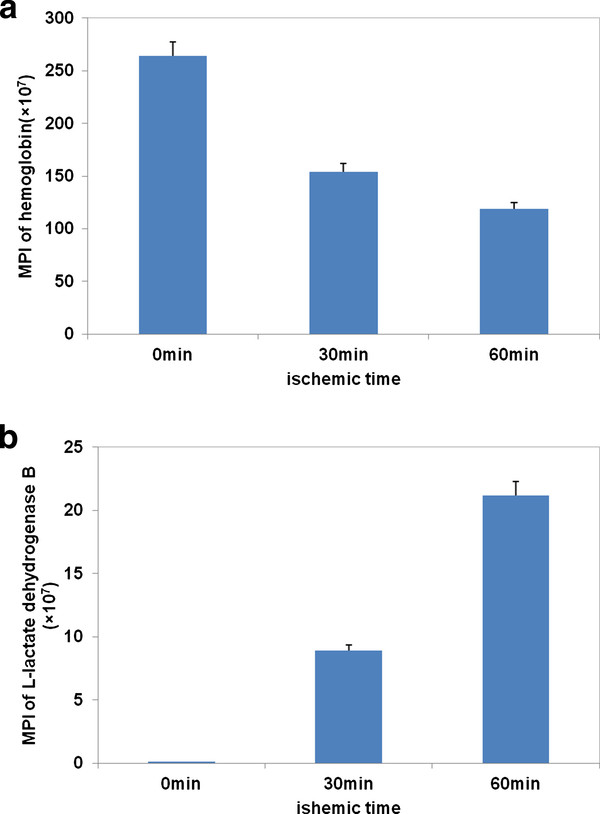
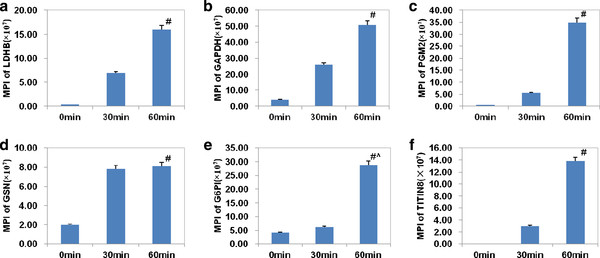
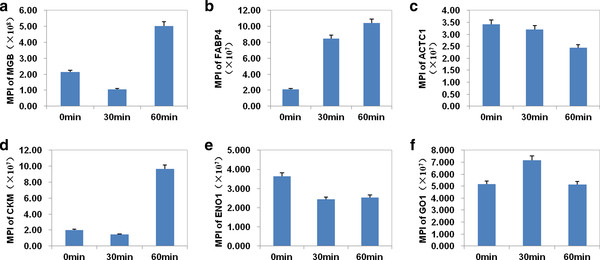
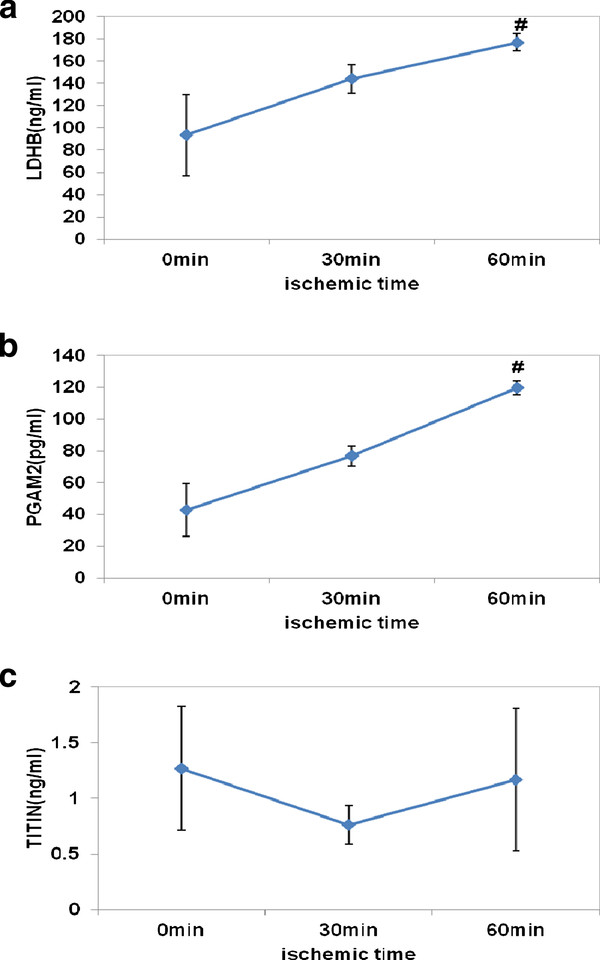
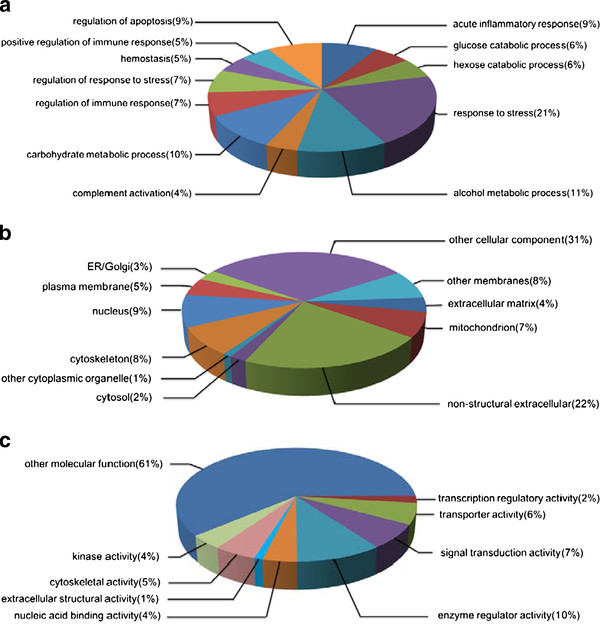
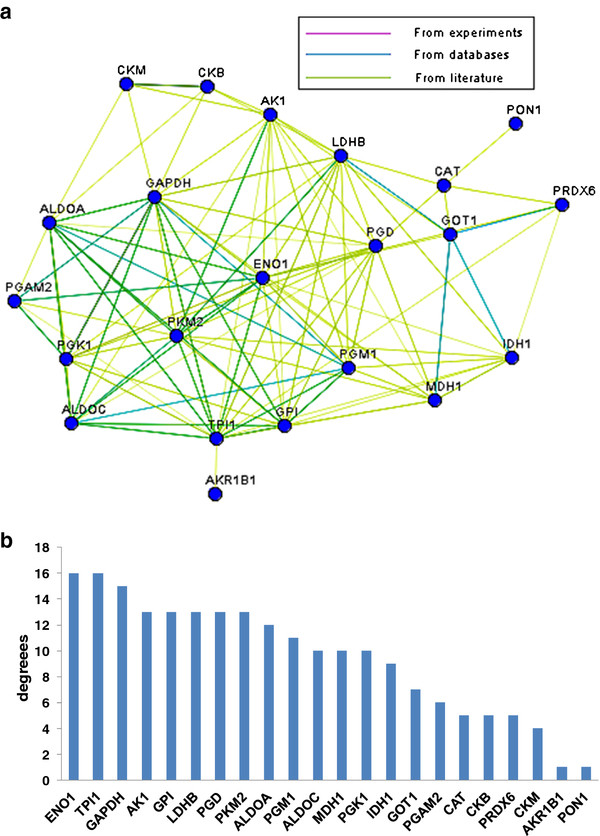
Results: After global ischemia for 0 min, 30 min and 60 min at 4°C, effluents from five perfused hearts were analyzed respectively, by High performance liquid chromatography-Chip-Mass spectrometry (HPLC-Chip-MS) system. Total 196 highly reliable proteins were identified. 107 proteins were identified at the beginning of ischemia, 174 and 175 proteins at ischemic 30 min and ischemic 60 min, respectively. With the exception of cardiac troponin I and T, all known biomarkers for myocardial ischemia were detected in our study. However, there were four glycolytic enzymes and two targets of matrix metalloproteinase released significantly from the heart when ischemic time was increasing. These proteins were L-lactate dehydrogenase B(LDHB), glyceraldehyde-3-phosphate dehydrogenase, glucose-6-phosphate isomerase (GPI), phosphoglycerate mutase 2 (PGAM2), gelsolin and isoform 8 of titin. PGAM2, LDHB and titin were measured with enzyme-linked immunosorbent assays kits. The mean concentrations of LDHB and PGAM2 in samples showed an increasing trend when ischemic time was extending. In addition, 33% identified proteins are involved in metabolism. Protein to protein interaction network analysis showed glycolytic enzymes, such as isoform alpha-enolase of alpha-enolase, isoform 1 of triosephosphate isomerase and glyceraldehyde-3-phosphate dehydrogenase, had more connections than other proteins in myocardial metabolism during ischemia.

Conclusion: It is the first time to use effluents of human perfused heart to study the proteins released during myocardial ischemia by HPLC-Chip-MS system. There might be many potential biomarkers for mild ischemic injury in myocardium, especially isoform 8 of titin and M-type of PGAM2 that are more specific in the cardiac tissue than in the others. Furthermore, glycolysis is one of the important conversions during early ischemia in myocardium. This finding may provide new insight into pathology and biology of myocardial ischemia, and potential diagnostic and therapeutic biomarkers.


Figures

Figure 1
Figure 1
Chromatogram of the affinity removal of high-abundant proteins from the effluent. Injections of 75 ul of 4 × diluted effluent in buffer A were made on a Multiple Affinity Removal Column (4.6 × 50 mm) at a flow rate of 0.25 ml/min in buffer A. Flow-through fractions were collected from 1.5 - 4.5 min. The bound fraction was eluted with buffer B at a flow rate of 1.0 ml/min for 3.5 min.
Figure 2
Figure 2
Molecular weight and pI distribution of proteins identified consistently in five hearts' effluents. A. Presented was pI distribution of identified proteins. B. Presented was molecular masses distribution of identified proteins.
Figure 3
Figure 3
The relationship between the number of proteins identified by HPLC-Chip-MS system and ischemic time. Longer durations of ischemia increased the number of identified proteins.107 proteins were identified at the beginning of ischemia, 174 and 175 proteins were identified respectively at 30 min and 60 min after the onset of ischemia.
Figure 4
Figure 4
The relationship between the mean of peak intensities(MPI) and ischemic time. A. Presented was the relationship between the mean of peak intensities and ischemic time in hemoglobin. B. Presented was the relationship between the mean of peak intensities and ischemic time in L-lactate dehydrogenase B.
Figure 5
Figure 5
Six proteins released significantly into the effluents during myocardial ischemia by quantitative analysis of the mean of the peak intensities (MPI). A. The MPI of L-lactate dehydrogenase B (LDHB). B. The MPI of glyceraldehyde-3-phosphate dehydrogenase (GAPDH). C. The MPI of glucose-6-phosphate isomerase (GPI). D. The MPI of phosphoglycerate mutase 2 (PGAM2). E. The MPI of gelsolin. F. The MPI of isoform 8 of titin. Among them, LDHB, GAPDH, GPI and PGAM2 are glycolytic enzymes. Gelsolin and isoform 8 of titin are targets of matrix metalloproteinase (MMP). Value are expressed as means ± SEM for each group. #p < 0.05 represents a significant difference in the ischemia for 30 min and ischemia for 60 min group compared with the ischemia for 0 min group; ^p < 0.05 represents a significant difference in the ischemia for 60 min group compared with the ischemia for 30 min group.
Figure 6
Figure 6
Six proteins specific to heart had little change in the effluents during myocardial ischemia by quantitative analysis of the mean of the peak intensities (MPI). A. The MPI of MB.B. The MPI of H-FABP. C. The MPI of alpha actin. D. The MPI of CK-M. E. The MPI of ENO1. F. The MPI of PKM2.
Figure 7
Figure 7
Comfirmation of protein expression by ELISA. The concentration of three interesting proteins was quantitatively determinated with ELISA kits(n = 5). A. The mean concentration of LDHB.B. The mean concentration of PGAM2. C. The mean concentration of Titin. Value are expressed as means ± SEM for each group. #p < 0.05 represents a significant difference in the ischemia for 60 min group compared with the ischemia for 0 min group.
Figure 8
Figure 8
Gene Ontology classification generated by Software Tool for Researching Annotations of Proteins. Pie charts showing the classification of the identified proteins according to their biological functions, cellular component and molecular function. A. The biological functions of the identified proteins were diverse. However, a large percentage of them are related to the heart function during ischemia and reperfusion: ATP regeneration, metabolism (in particular glycolysis), oxidative stress response and protective proteins. 33% of the identified proteins were involved in the metabolic process for carbohydrate (22%) and alcohol (11%), 28% were involved in stress process and 9% were respectively involved in regulation of apoptosis and acute inflammatory response (Figure 7A). B. Of the 196 unique proteins identified in these experiments, only 31% were plasma proteins. The remainders were from the cellular organelles (28%) as well as a variety of other cellular components(41%). C. The molecular functions of the identified proteins were diverse, but a large percentage could be related to enzyme regulation (10%), signal transduction (7%), transporter (6%), cytoskeletal activity (5%).
Figure 9
Figure 9
The protein-protein interaction network on myocardial metabolism. A. protein-protein interaction network on metabolism was done by downloading pathway data from Kyoto Encyclopedia of Genes and Genomes(KEGG) database, then enzyme-enzyme interaction (ECrel) and protein-protein interaction (PPrel) was analyzed by KEGGSOAP software. Finally, the network of relationship among proteins was built and brought forth by Medusa software. The network was graphically visualized as nodes and edges. Pink lines indicate connections confirmed experimentally by other researches, blue lines indicate connections derived from databases and yellow lines indicate connections compiled from co-citation data from literature mining PubMed abstracts. Interestingly, about 55% of those proteins showing in the network are involved in glycolysis. B. The number of connections of each protein was calculated. ENO1, TPI1 and GAPDH are central "functional hubs" in the map with more connections than other proteins. They are all important glycolytic enzymes in myocardium.

Similar articles

Cited by

References

    1. World Health Organization Department of Health Statistics and Informatics in the Information, Evidence and Research Cluster. The global burden of disease update. Geneva: WHO; 2004. ISBN 9241563710.
    1. Morrow DA, Lemos JA, Sabatine S, Antman EM. The search for a biomarker of cardiac ischemia. Clin Chem. 2003;49:537–539. doi: 10.1373/49.4.537. - DOI - PubMed
    1. Lewis GD, Wei R, Liu E, Yang E, Shi X, Martinovic M, Farrell L, Asnani A, Cyrille M, Ramanathan A. et al.Metabolite profiling of blood from individuals undergoing planned myocardial infarction reveals early markers of myocardial injury. J Clin Invest. 2008;118:3503–3512. doi: 10.1172/JCI35111. - DOI - PMC - PubMed
    1. Edwards AV, White MY, Cordwell SJ. The role of proteomics in clinical cardiovascular biomarker discovery. Mol Cell Proteomics. 2008;7:1824–1837. doi: 10.1074/mcp.R800007-MCP200. - DOI - PubMed
    1. Thadikkaran L, Siegenthaler MA, Crettaz D, Queloz PA, Schneider P, Tissot JD. Recent advances in blood-related proteomics. Proteomics. 2005;5:3019–3034. doi: 10.1002/pmic.200402053. - DOI - PubMed