. 2012 Apr 24;22(8):668-75.
doi: 10.1016/j.cub.2012.02.065. Epub 2012 Mar 22.

Free extracellular diffusion creates the Dpp morphogen gradient of the Drosophila wing disc

Affiliations

Free extracellular diffusion creates the Dpp morphogen gradient of the Drosophila wing disc

Shaohua Zhou et al. Curr Biol. .

Abstract

Background: How morphogen gradients form has long been a subject of controversy. The strongest support for the view that morphogens do not simply spread by free diffusion has come from a variety of studies of the Decapentaplegic (Dpp) gradient of the Drosophila larval wing disc.

Results: In the present study, we initially show how the failure, in such studies, to consider the coupling of transport to receptor-mediated uptake and degradation has led to estimates of transport rates that are orders of magnitude too low, lending unwarranted support to a variety of hypothetical mechanisms, such as "planar transcytosis" and "restricted extracellular diffusion." Using several independent dynamic methods, we obtain data that are inconsistent with such models and show directly that Dpp transport occurs by simple, rapid diffusion in the extracellular space. We discuss the implications of these findings for other morphogen systems in which complex transport mechanisms have been proposed.

Conclusions: We believe that these findings resolve a major, longstanding question about morphogen gradient formation and provide a solid framework for interpreting experimental observations of morphogen gradient dynamics.


Figures

Fig. 1
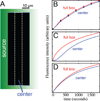
Fig. 1. Fluorescence recovery after photobleaching (FRAP) can provide little or no information about transport
In models of morphogen transport by extracellular diffusion with cellular uptake, accumulation, and degradation, if diffusion is fast enough, overall FRAP kinetics will tend to reflect the time scale of degradation, not transport. This is illustrated by simulating the expected results of FRAP within a 10 µm-wide stripe adjacent to the source of the morphogen Dpp in the Drosophila wing disc according either to a model of transcytotic transport (blue) with an effective diffusion coefficient of 0.1 µm2 sec−1 [9], or a model based on free extracellular diffusion with uptake (red, dashed), with a diffusion coefficient of 20 µm2 sec−1. For further details, see SI.
Fig. 2
Fig. 2. Lack of spreading of photoactivated DppDendra2
(A-D) Confocal images of a DppDendra2-expressing wing disc before and after photoactivation (PA). Before PA, bilaterial exponential gradients are observed along the horizontal (anteroposterior axis) in the green channel (A) with minimal red signal (C). PA was carried out in two rectangular regions (red boxes in A, B) using a 20 µsec pulse of 405 nm light, producing two red fluorescent stripes (D). (E-H) Images after PA. Five optical slices covering the apical part of the disc were taken at 5-minute intervals for 30 min, maximum-projected, and intensity profiles calculated (similar results were obtained when optical slices were summed, instead of maximum-projected). Cyan boxes in E-H are magnified in I-L. (M) Average intensity along the vertical (dorsoventral axis) is plotted along the horizontal axis of the cyan box in C and D. (N) Intensity profiles along the horizontal axis of the yellow box (see inset) at times after PA. (O) Average intensities inside the proximal (near the morphogen source) and distal PA-stripes, and the region lying between them (“middle stripe”), at different times. The proximal, middle and distal stripes correspond to the blue, green and red regions in the inset. (P-Z) Spreading of photoactivated WinglessDendra2. Panels P-T are time-lapse images from a wing disc expressing WinglessDendra2 in the Dpp domain (dpp-gal4/UAS-WinglessDendra2) and photoactivated and imaged as in A-D. (U-Y) Magnified views of the cyan boxes in P-T. (Z) Intensity profiles along the horizontal axis of each cyan box were plotted at different time points. Dashed lines mark the boundaries of the two photoactivated regions. Note significant spreading of fluorescence (arrow). In addition, in Dpp-Dendra2-expressing discs in which the entire disc (including the production region) was photoactivated, except for a small stripe, we also observed some spreading of fluorescence into the non-photoactivated region (data not shown). Bars in A-H, P-T = 10 µm.
Fig. 3
Fig. 3. Results of “spatial” FRAP support transport by rapid diffusion
Whereas the kinetics of FRAP within a single photobleached region cannot necessarily distinguish between slow and fast transport (see Fig. 1), it should be possible to do so by comparing FRAP kinetics at different locations within a photobleached region. As diagrammed in (A), a 30 × 150 µm wide rectangle was photobleached in the posterior compartment of a DppDendra2-expressing wing disc and observed at multiple locations for 30 min. Fluorescence intensities, corrected for bleach depth, were measured for the entire box, as well as for a 10 × 150 µm region in the center of the box. The results of a typical experiment are shown in (B). The predictions of models based on transcytosis (D=0.1 µm2 sec−1) and free extracellular diffusion (D= 20 µm2 sec−1) are shown in (C) and (D), respectively. Note the significant time displacement (~250 sec) between the two curves required by the transcytosis model (C; similar behavior would be produced by slow, “restricted extracellular diffusion”). The delay corresponds to the time required for a molecule with D=0.1 µm2 sec−1 to travel 10 µm.
Fig. 4
Fig. 4. Measuring extracellular diffusion of Dpp
(A) Confocal images of DppDendra2-expressing wing discs used for FCS. Green: DppDendra2; red: FM4-64 (to label cell membranes). Cross hairs mark location of FCS measurement. Inset shows a magnified view. Bar=10 µm. (B) Autocorrelation curves for DppDendra2 (green) and a membrane-anchored control, cd8GFP (grey; expressed under the control of dpp-Gal4). Data from DppDendra2 fit a two-component diffusion model with fast and slow components. (C) Proportions of molecules in fast and slow pools measured for DppDendra2 (as in B) and DppGFP (not shown). (D) Caclulated diffusion coefficients. Each point represents an independent measurement at a different location in a total of 11 wing discs for DppDendra2 and 4 wing discs for DppGFP. Averages (black bars) were 21 ± 3 µm2 sec−1 and 0.03 ± 0.006 µm2 sec−1 for DppDendra2, and 10 ± 1 µm2 sec−1 and 0.08 ± 0.01 µm2 sec−1 for DppGFP (values are means ± SEM). (E) Pair correlation function (pCF) microscopy was carried out by repeatedly scanning a 3.2 µm-long line along a site of cell contact in a DppDendra2-expressing disc (stained as in A). Bar=1µm. Fluorescence intensities were converted to an intensity carpet (F), in which the horizontal and vertical directions represent position and time, respectively, and intensity is color-coded. Autocorrelation, calculated at each location and averaged over all locations was plotted (“ACF”) in (G). For pair correlation, fluctuations in each of five pixels (depicted in green along the line in E) were each cross-correlated with pixels 5 positions to the right (depicted in yellow in E), and the correlation curves averaged and plotted (“pCF5”). The position of the peak in the pCF5 curve corresponds to the average time delay required for DppDendra2 to move 5 pixels.

References

    1. Crick FHC. Diffusion in Embryogenesis. Nature. 1970;225:420–422. - PubMed
    1. Lander AD, Nie Q, Wan FY. Do morphogen gradients arise by diffusion? Dev Cell. 2002;2:785–796. - PubMed
    1. Eldar A, Dorfman R, Weiss D, Ashe H, Shilo BZ, Barkai N. Robustness of the BMP morphogen gradient in Drosophila embryonic patterning. Nature. 2002;419:304–308. - PubMed
    1. Eldar A, Rosin D, Shilo BZ, Barkai N. Self-enhanced ligand degradation underlies robustness of morphogen gradients. Dev Cell. 2003;5:635–646. - PubMed
    1. Mizutani CM, Nie Q, Wan FY, Zhang YT, Vilmos P, Sousa-Neves R, Bier E, Marsh JL, Lander AD. Formation of the BMP activity gradient in the Drosophila embryo. Dev Cell. 2005;8:915–924. - PMC - PubMed

Publication types

Substances