. 2012 Mar 22;73(6):1083-99.
doi: 10.1016/j.neuron.2012.03.002. Epub 2012 Mar 21.

Transcriptional architecture of the primate neocortex

Affiliations

Transcriptional architecture of the primate neocortex

Amy Bernard et al. Neuron. .

Abstract

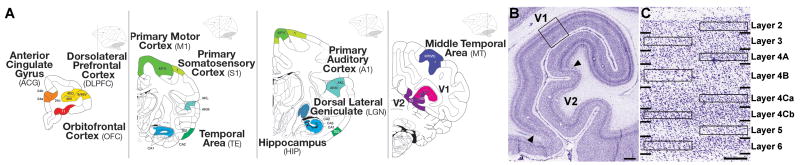
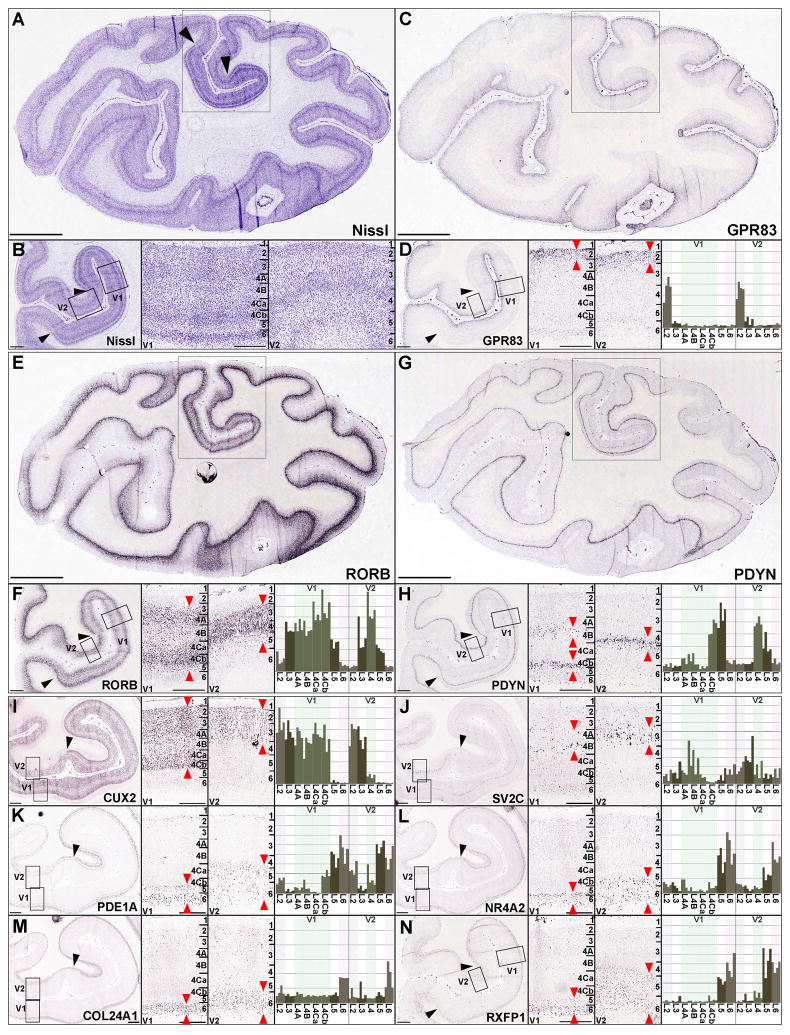
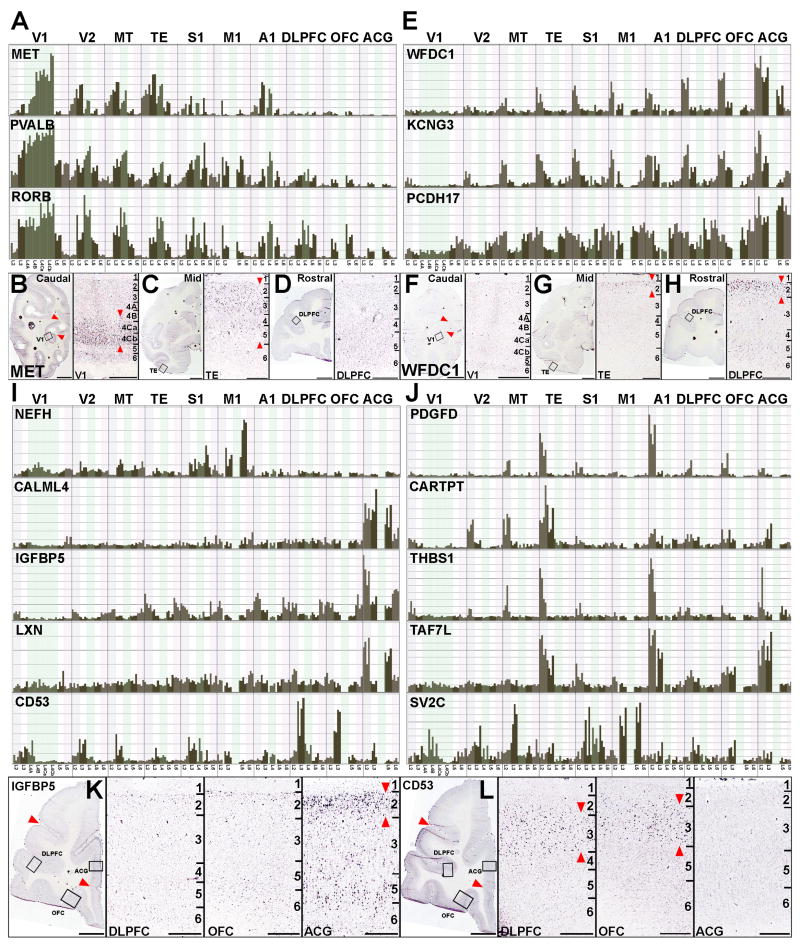
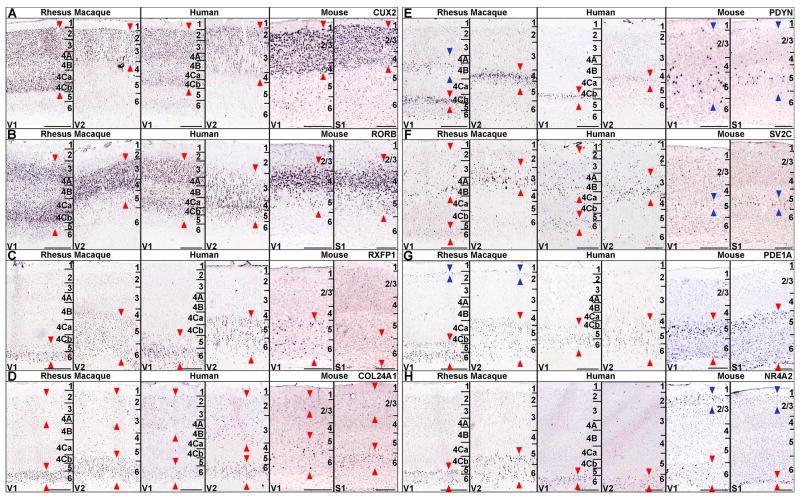
Genome-wide transcriptional profiling was used to characterize the molecular underpinnings of neocortical organization in rhesus macaque, including cortical areal specialization and laminar cell-type diversity. Microarray analysis of individual cortical layers across sensorimotor and association cortices identified robust and specific molecular signatures for individual cortical layers and areas, prominently involving genes associated with specialized neuronal function. Overall, transcriptome-based relationships were related to spatial proximity, being strongest between neighboring cortical areas and between proximal layers. Primary visual cortex (V1) displayed the most distinctive gene expression compared to other cortical regions in rhesus and human, both in the specialized layer 4 as well as other layers. Laminar patterns were more similar between macaque and human compared to mouse, as was the unique V1 profile that was not observed in mouse. These data provide a unique resource detailing neocortical transcription patterns in a nonhuman primate with great similarity in gene expression to human.


Figures

Figure 1
Figure 1. Experimental Paradigm for Profiling Macaque Cortical Regions and Layers
(A) Reference atlas plates from rostral (upper left) to caudal (lower right) illustrating approximate locations of ten cortical regions targeted for microarray profiling, as well as the hippocampus and thalamic dorsal lateral geniculate nucleus. (B) A Nissl-stained section of visual cortex centered on the calcarine fissure, corresponding to the lower right panel in (A). (C) High magnification image of V1 (boxed area in (B)) showing detailed laminar architecture (numbers) and approximate delineations used for conservative isolation of individual cortical layers using laser microdissection (boxes). V1, primary visual cortex; V2, secondary visual cortex. Scale bars: 1mm in B, 250μm in C. Panels in (A) modified with permission from Paxinos, Huang and Toga (Paxinos et al., 2000). Detailed anatomical sampling locations shown in Figure S1, and representative sample isolations in Table S1.
Figure 2
Figure 2. Major Organizational Features of the Rhesus Neocortical Transcriptome
(A-C) PCA of cortical, hippocampal and thalamic samples (A) or cortical samples alone colored by cortical region (B) or layer (C). The first three components in (A) accounted for 12.5%, 8.7% and 6.8% of variance respectively. The first three components in B and C accounted for 13.6%, 8.5% and 6.6% respectively. (D) 3-way ANOVA of the cortical samples showing number of differentially expressed genes versus statistical significance for cortical regions, layers and animals. The high degree of overlap between genes showing differential expression across these three variables is shown in the Venn diagram in E (ANOVA p< 10-12 for each variable). (F) Cluster dendrograms representing probe assignment to modules in WGCNA. (G) Module eigengene plots for a male-enriched module (lightyellow, top panel) and an individual animal-related module (grey60, lower panel). Samples in (G) are organized by cortical region from caudal (V1) to rostral (ACG), and by layer within each region from superficial L2 to deep L6). Male samples in upper panel have grey background. Samples in lower panel are identified by animal (#1-5), and all samples from animal #2 have light green background. PCA and ANOVA details are provided in Figure S2 and Table S2.
Figure 3
Figure 3. Robust Transcriptional Signatures of Cortical Laminar Structure
(A) 1D clustering of genes showing differential laminar expression (ANOVA p< 10-12) across all cortical samples, with selected enriched gene sets for each cluster (BF corrected p<.01). (B) Module versus layer relationships based on whole cortex WGCNA, with individual modules showing strong correlations to individual cortical layers (red indicates high correlations). Red arrows under module names indicate modules shown in panel C. (C) Identification of genes selectively expressed in specific cortical layers. Displayed are genes with correlation coefficient >0.7 (L2) or >0.6 (L3-6) to artificial templates (red bars) in each layer across all cortical areas (see Methods). (D) Layer-enriched network modules. Plotted are the top 30 (black, salmon) or top 20 (greenyellow, royalblue, red) hub genes from 5 modules showing different patterns of laminar enrichment. Individual gene profiles in C and D were normalized by the mean expression value for that gene for display on same scale. ANOVA (E) and WGCNA (F) of V1 samples only. (E) 2D clustering of genes showing differential laminar expression among V1 samples (ANOVA, p<10-3), with selected gene set enrichment results (BF corrected p<0.1). (F) Module versus layer relationships based on V1 WGCNA. Dendrograms in B, E, F show strongest relationships between proximal layers, and a distinct signature associated with the specialized L4 sublayers of V1. Module assignment and gene set enrichment for WGCNA, ANOVA and template analyses are provided in Tables S3-8.
Figure 4
Figure 4. Layer-specific Gene Expression in Visual Cortical Areas
(A and B) Coronal Nissl-stained section of caudal macaque neocortex containing areas V1 and V2 at low magnification (A) and higher magnifications (B). Left panel in (B) corresponds to boxed region in (A); right panels show high magnification views of areas V1 and V2 corresponding to boxes in left panel. (C, E, G) Low magnification images of ISH labeling for GPR83 (C), RORB (E) and PDYN (G). (D, F, G) Corresponding medium magnification image (left panel), high magnification views of V1 and V2 (middle panels), and histogram plots of gene expression for layer-specific samples in V1 and V2 (4 replicates per layer, right panels). (F-N) ISH and microarray data for CUX2 (I), SV2C (J), PDE1A (K), NR4A2 (L), COL24A1 (M), and RXFP1 (N), displayed in the same format as upper panels. Black arrowheads delineate boundaries of V1, numerals in high magnification ISH and Nissl panels denote laminar architecture of V1 and V2, and red arrows denote regions of enriched expression. Scale bars: Low magnification images in A, C, E, G: 5mm; medium magnification images in B, D, F, H, I, J, K, L, M, N: 1mm, high magnification images: 500μm.
Figure 5
Figure 5. Molecular Signatures of Cortical Regions
(A) 2D cluster of genes differentially expressed between cortical regions (ANOVA, p<10-12), with selected enriched gene sets for specific clusters (BF corrected p<.01). (B) Module versus region relationships based on whole cortex WGCNA. Individual modules show strong correlations to subsets of cortical regions, and proximal regions show the strongest similarity. (C) Module eigengene plots for tan (upper left, caudal to rostral high gradient), purple (upper right, rostral to caudal high gradient), blue (lower left, V2, MT, DLPFC, OFC high), and pink (TE, A1, ACG high) modules. Further ANOVA is provided in Table S9 and Figure S3.
Figure 6
Figure 6. Diversity of Regional Gene Expression Patterns
(A) Caudal high to rostral low gradients. Normalized expression histograms for MET, PVALB, and RORB across cortical areas and layers. (B-D) ISH for MET in caudal (B), mid rostrocaudal (C) and rostral (D) sections at low (left panels) and high magnification (right panels, corresponding to boxed areas in left panels). E. Caudal low to rostral high gradients, with normalized expression histograms for WFDC1, KCNG3 and PCDH17. (F-H) ISH for WFDC1 in caudal (F), mid rostrocaudal (G) and rostral (H) sections at low (left panels) and high magnification (right panels, corresponding to boxed areas in left panels). I. Genes displaying robust region-specific expression, including NEFH in M1, CALML4, IGFBP5, and LXN in ACG, and CD53 in DLPFC and OFC. J. Complex regional gene expression patterns for PDGFD, CARTPT, THBS1, TAF7L, and SV2C. K, L. ISH for frontal cortex enriched genes in (I), including selective IGFBP5 expression in ACG relative to DLPFC and OFC (K) and selective expression of CD53 in DLPFC and OFC relative to ACG (L). High magnification panels correspond to boxed regions in low magnification panels. Red arrowheads in low magnification images in B and F delineate boundaries of area V1. Red arrowheads in high magnification ISH figures delineate predominant laminar patterns. Scale bars: low magnification in B-D, F-H, K, L: 5mm; high magnification: 500μm.
Figure 7
Figure 7. Cross-species Comparison of Laminar Gene Expression Patterns Between Adult Macaque, Human and Mouse Neocortex
ISH data for CUX2 (A), RORB (B), RXFP1 (D), COL24A1 (D), PDYN (E), SV2C (F), PDE1A (G), and NR4A2 (H). Left panels show cellular expression patterns in macaque V1 and V2, middle panels show expression in human V1 and V2, and right panels show expression in P56 mouse V1 and S1. (A-D) Genes displaying predominantly similar laminar expression patterns across all three species. (E-H) Genes displaying qualitative differences in laminar patterns between macaque, human and mouse. Red arrows delineate macaque expression and conserved expression in human and mouse. Blue arrows delineate expression showing qualitative differences between species. Scale bars: 500μm (macaque, human), 250μm (mouse). Human ISH data from the Allen Human Brain Atlas, and mouse ISH data from the Allen Mouse Brain Atlas.
Figure 8
Figure 8. V1-selective Macaque Patterns of Gene Expression and Cross-species Comparisons
(A-F) Microarray (lower panels) and ISH (upper panels) analysis of genes enriched (A-C) or lowest (D-F) in macaque V1. (A-C) Enriched expression in V1 for ASAM, VAV3 and ESRRG, primarily in L4. Low magnification ISH centered on calcarine sulcus (left), and high magnification images of V1 and V2 corresponding to boxed areas. Layers showing higher expression in V1 are delineated by red arrows in ISH panels. Lower panels show sample-level histogram plots of normalized expression intensities across cortical areas (V1 samples delineated by red boxes). (D-F) Genes selectively lowest in V1, including MEPE (D), RBP4 (E) and CTGF (F). Areas of high expression are denoted by red arrows in V2 by ISH. (G-H) Comparative analysis of V1-selective ISH patterns in macaque (upper panels), human (lower left) and mouse (lower right). Upper panels: ISH (upper) and microarray (lower) analysis of gene expression at low (left) and high magnification (V1, V2, right panels) for SYT6 (G), NPY2R (H) and HTR2C (I). Note higher expression (red arrows) in V1 for SYT6 and NPY2R, and lower expression in V1 for HTR2C. Lower panels in G-I show corresponding ISH data for adult human V1 and V2 and adult mouse V1 and S1. Red arrows delineate patterns with similar laminar and areal expression to macaque, while blue arrows denote differential expression between rodents and primates. Large black arrowheads in A, E, G, H, I delineate boundaries of area V1. Scale bars: Low magnification: 5mm; high magnification: 500μm (macaque, human), 250μm (mouse).

Comment in

References

    1. Abrahams BS, Tentler D, Perederiy JV, Oldham MC, Coppola G, Geschwind DH. Genome-wide analyses of human perisylvian cerebral cortical patterning. Proc Natl Acad Sci U S A. 2007;104:17849–17854. - PMC - PubMed
    1. Arlotta P, Molyneaux BJ, Chen J, Inoue J, Kominami R, Macklis JD. Neuronal subtype-specific genes that control corticospinal motor neuron development in vivo. Neuron. 2005;45:207–221. - PubMed
    1. Bassett DS, Bullmore E. Small-world brain networks. Neuroscientist. 2006;12:512–523. - PubMed
    1. Belgard TG, Marques AC, Oliver PL, Abaan HO, Sirey TM, Hoerder-Suabedissen A, Garcia-Moreno F, Molnar Z, Margulies EH, Ponting CP. A transcriptomic atlas of mouse neocortical layers. Neuron. 2011;71:605–616. - PMC - PubMed
    1. Bishop KM, Rubenstein JL, O’Leary DD. Distinct actions of Emx1, Emx2, and Pax6 in regulating the specification of areas in the developing neocortex. J Neurosci. 2002;22:7627–7638. - PMC - PubMed

Publication types

MeSH terms