. 2012 Mar 22;73(6):1204-15.
doi: 10.1016/j.neuron.2011.12.040. Epub 2012 Mar 21.

A network diffusion model of disease progression in dementia

Affiliations

A network diffusion model of disease progression in dementia

Ashish Raj et al. Neuron. .

Abstract

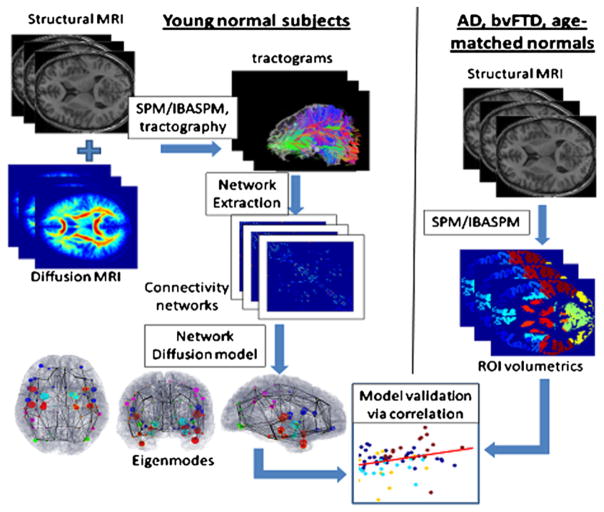
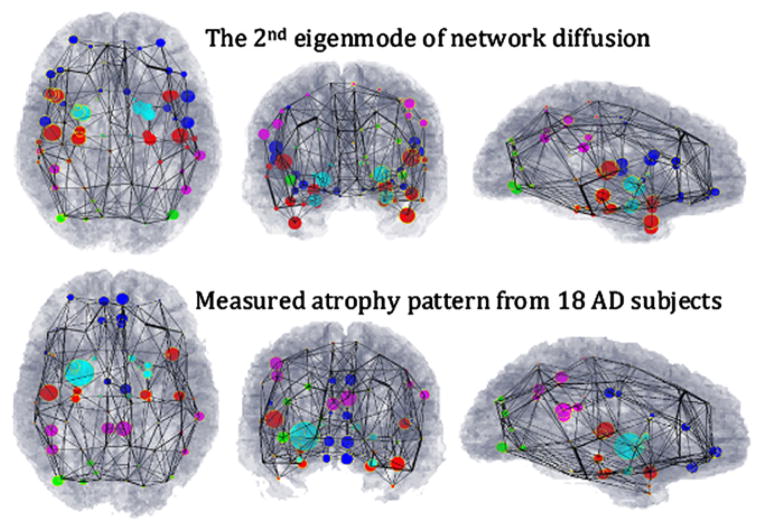
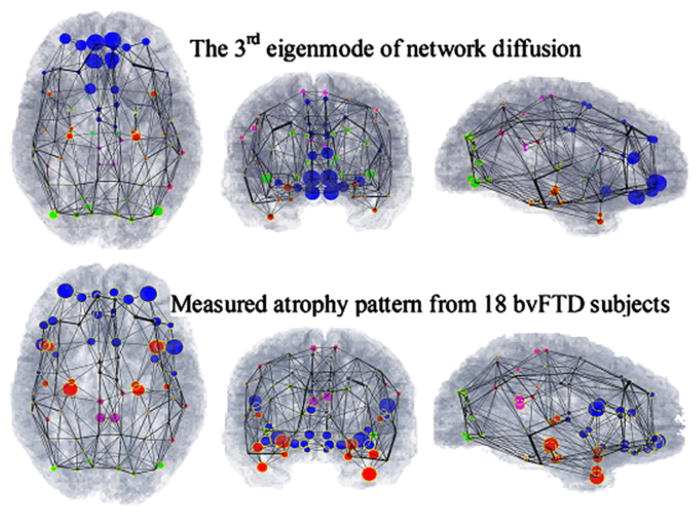
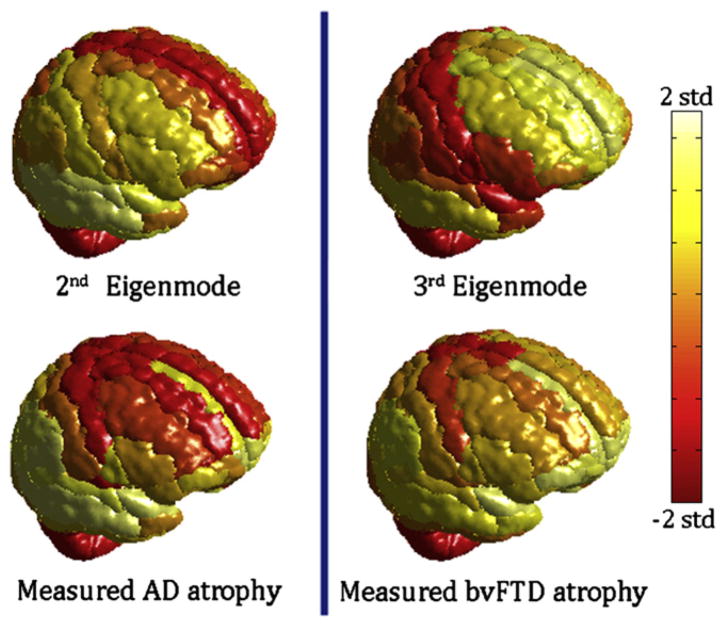
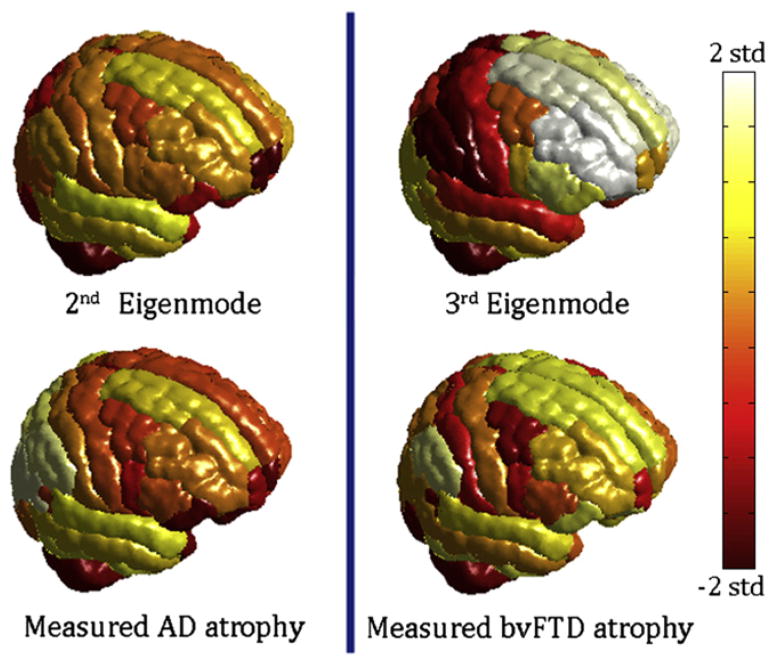
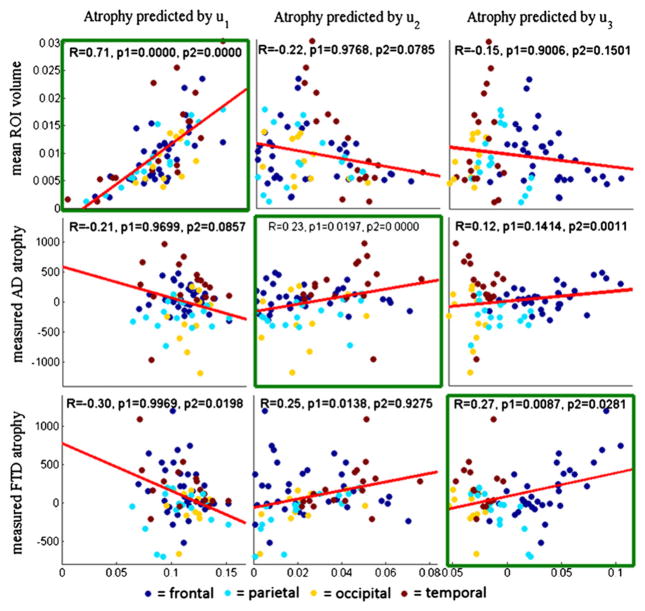
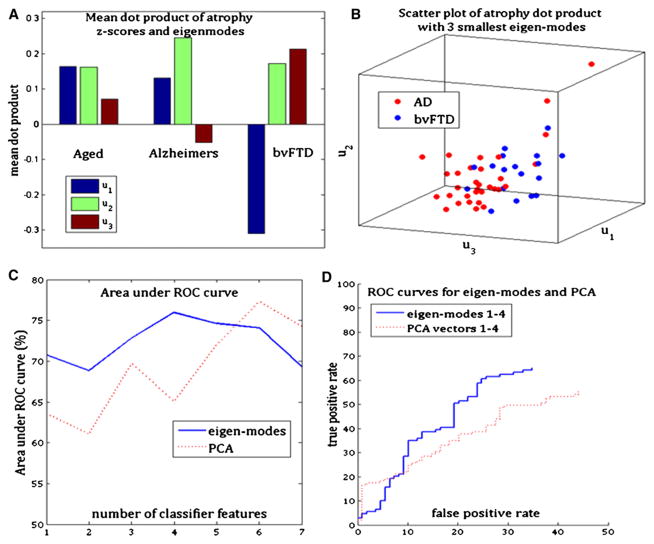
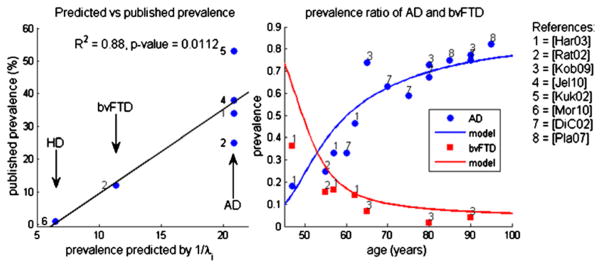
Patterns of dementia are known to fall into dissociated but dispersed brain networks, suggesting that the disease is transmitted along neuronal pathways rather than by proximity. This view is supported by neuropathological evidence for "prion-like" transsynaptic transmission of disease agents like misfolded tau and beta amyloid. We mathematically model this transmission by a diffusive mechanism mediated by the brain's connectivity network obtained from tractography of 14 healthy-brain MRIs. Subsequent graph theoretic analysis provides a fully quantitative, testable, predictive model of dementia. Specifically, we predict spatially distinct "persistent modes," which, we found, recapitulate known patterns of dementia and match recent reports of selectively vulnerable dissociated brain networks. Model predictions also closely match T1-weighted MRI volumetrics of 18 Alzheimer's and 18 frontotemporal dementia subjects. Prevalence rates predicted by the model strongly agree with published data. This work has many important implications, including dimensionality reduction, differential diagnosis, and especially prediction of future atrophy using baseline MRI morphometrics.


Figures

Figure 1
Figure 1. Process Diagram Depicting Our Methodology
(Left) Structural healthy brain networks were obtained from diffusion MRI scans of 14 young healthy volunteers, followed by whole brain tractography. The nodes of this network correspond to cortical and subcortical gray matter regions obtained from a labeled T1-weighted brain atlas, and the edges of this network are proportional to the number and strength of the fiber tracts that connect the nodes. Proposed network diffusion model and its eigenmodes are derived from this healthy network. The first three eigenmodes, which we have hypothesized to be predictive of dementia atrophy patterns, are then tabulated and plotted. (Right) We then compare the predicted patterns with measured atrophy of dementia patients (AD, bvFTD, and age-matched normal subjects), obtained via a completely separate processing pipeline, available in the SPM Matlab toolbox. T1-weighted images of each subject were coregistered with the same atlas as in the left panel, and gray-matter regions were parcellated using the prelabeled atlas information. Volume of each cortical and subcortical gray-matter region was measured. The atrophy of each region was obtained in terms of a t-statistic between the diseased and age-matched normal groups. Finally, the predicted and measured atrophy patterns were statistically compared using correlation analysis.
Figure 2
Figure 2. Visual Correspondence between Theoretical Prediction and Measured Alzheimer’s Atrophy Pattern
Theoretical prediction is based on the second eigenmode of the young healthy brain network’s Laplacian matrix H. Measured Alzheimer’s atrophy pattern is based on t-scores of gray-matter volumes in 18 Alzheimer’s subjects). We have depicted whole-brain atrophy patterns using a wire-and-ball mesh plot, where each parcellated GM region in the brain is represented by a node in the network, depicted as a ball. The connectivity between two regions is depicted by a wire whose thickness denotes connection strength. Note that the network depicted here was separately obtained from the young healthy cohort, and is identical in all panels. (Top) Predicted distribution, where the value of the second eigenmode at each node is denoted by the size of the corresponding ball. (Bottom) Measured atrophy (t-statistic) of all 18 AD subjects in our study. Again the size of the ball represents the amount of atrophy measured in the corresponding GM region. The regions are color coded by lobe (blue, frontal lobe structures; purple, parietal lobe; green, occipital lobe, red, temporal lobe, and cyan, subcortical). A close homology is observed between predicted and measured atrophy patterns. See also Figures S1–S3 and S5.
Figure 3
Figure 3. Visual Correspondence between Theoretical Prediction and Measured Atrophy Patterns
(Top) The third eigenmode of young healthy whole brain connectivity network’s Laplacian matrix. (Bottom) Measured atrophy (t-statistic) in our 18 bvFTD subjects. A close homology is observed between the theoretical and measured atrophy patterns. See also Figures S2 and S3.
Figure 4
Figure 4. Cortical Atrophy of AD and bvFTD, and the Second and Third Eigenmodes Atrophy Scores Are Mapped onto the Cortical Surface Using the 90 Region AAL Cerebral Atlas
Atrophy, as well as eigenmode values, were converted into z-scores and mapped to the range shown by the colorbar. Extreme levels (±2 SD from mean value) were assigned the maximum/minimum color. Although there are areas of disagreement with our volumetric data, the eigenmodes roughly resemble the classic atrophy patterns seen in each disease.
Figure 5
Figure 5. Cortical Atrophy and Eigenmodes Mapped onto the Cortical Surface using a Different Atlas
Scores are mapped onto the cortical surface using the 86-region FreeSurfer atlas. Volumetric data were obtained by the FreeSurfer software and the brain network was also recomputed under this new parcellation. Measured atrophy patterns generally match the cortical atrophy seen using the AAL atlas (Figure 4), but exact match is not to be expected due to both methodological and ROI size and shape differences. It is important to note, however, that measured atrophy is still roughly in accordance with the eigenmodes, which remain consistent with classic AD/bvFTD pathology.
Figure 6
Figure 6. Correlations between Measured Atrophy of AD/bvFTD versus Predicted Atrophy from the First Three Eigenmodes of the Young Healthy Network
The x axis in each panel represents a measured statistic: normal ROI volume (top), t-score of ROI volume of AD versus age-matched control groups (middle), and t-score of ROI volume of bvFTD versus age-matched control (bottom). The y axes are eigenmodes of the healthy network: u1 (left column), u2 (middle column), and u3 (right column). Each dot in the scatter plots represents a single GM region, and dots are color coded by lobe. A line of best fit is also shown in each panel. Correlations within diagonally located panels are high, and correlations in off-diagonal panels are low. Plots that show significance in both Pearson correlation and the two-group t test are indicated by green boxes, and they are along the diagonal panels. This validates our hypothesis that there is a one-to-one correspondence between eigenmodes and dementia atrophy. See also Figures S4 and S5 and Supplemental Experimental Procedures.
Figure 7
Figure 7. Demonstrating the Utility of the Eigenmodes for Dimensionality Reduction, Differential Diagnosis, and Classification
(A) Mean dot product between atrophy and the first three eigenmodes for each dementia group. The aged but cognitively normal group shows mixed presence of all three eigenmodes, whereas the other two disease groups show primary presence of the eigenmode hypothesized to be associated with the disease. (B) Scatter plot of the dot product in (A) for AD and bvFTD subjects, showing clear separation of the two groups after projection onto the eigenmodes. (C) Area under the ROC curve of three-way classification at various dimensions of feature space, based on eigenmodes as well as PCA. This plot shows that the eigenmodes are doing at least as good a job of dimensionality reduction as the principal components analysis. (D) ROC curve of both classifiers, using four features each. The blue curve corresponds to classification using the first four eigenmodes of network diffusion, while the red curve corresponds to classification using the first four principle components of the atrophy z-scores. Clearly, the eigenmodes provide better classifiability in terms of area under the ROC curve. See also Figure S5.
Figure 8
Figure 8. Prevalence Rate of Various Dementias as Percentage of All Dementias
(Left) Published prevalence versus survival time predicted by network model. Note the strength of linear regression showing highly significant correlation. (Right) Published and predicted relative prevalence of AD versus bvFTD as a function of age. The numbers indicate the publication from which the nearby data point was obtained. Solid curves pertain to parameter-optimized model prediction. The curve shows extremely good fit of the model to published prevalence data, especially in later stages of life for which we have more reliable prevalence data. The theoretical prevalence of bvFTD is higher than measured prevalence in early stages of life, perhaps due to either model error or systematic under-estimation of bvFTD in younger populations.

Comment in

References

    1. Acosta-Cabronero Julio, Williams Guy B, Pengas George, Nestor Peter J. Absolute diffusivities define the landscape of white matter degeneration in Alzheimer’s disease. Brain. 2010;133:529–539. - PubMed
    1. Alemán-Gómez Y, Melie-García L, Valdés-Hernandez P. IBASPM: toolbox for automatic parcellation of brain structures. Presented at the 12th Annual Meeting of the Organization for Human Brain Mapping; Florence, Italy. 2005.
    1. Almond DP, Budd CJ, McCullen NJ. Emergent behaviour in large electrical networks. In: Georgoulis E, Iske A, Levesley J, editors. Approximation Algorithms for Complex Systems. New York: Springer; 2011. pp. 3–26.
    1. Apostolova LG, Steiner CA, Akopyan GG, Dutton RA, Hayashi KM, Toga AW, Cummings JL, Thompson PM. Three-dimensional gray matter atrophy mapping in mild cognitive impairment and mild Alzheimer disease. Arch Neurol. 2007;64:1489–1495. - PMC - PubMed
    1. Barreda JL, Zhou HX. A solvable model for the diffusion and reaction of neurotransmitters in a synaptic junction. BMC Biophys. 2011;4:5. - PMC - PubMed

Publication types

MeSH terms