. 2012 Mar 22;73(6):1216-27.
doi: 10.1016/j.neuron.2012.03.004. Epub 2012 Mar 21.

Predicting regional neurodegeneration from the healthy brain functional connectome

Affiliations

Predicting regional neurodegeneration from the healthy brain functional connectome

Juan Zhou et al. Neuron. .

Abstract

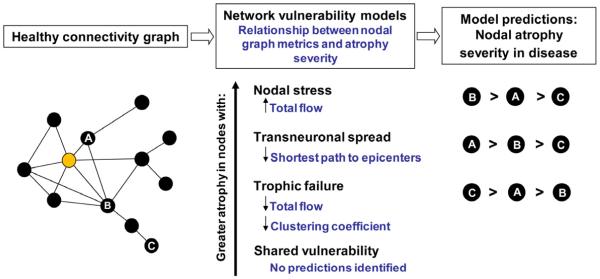
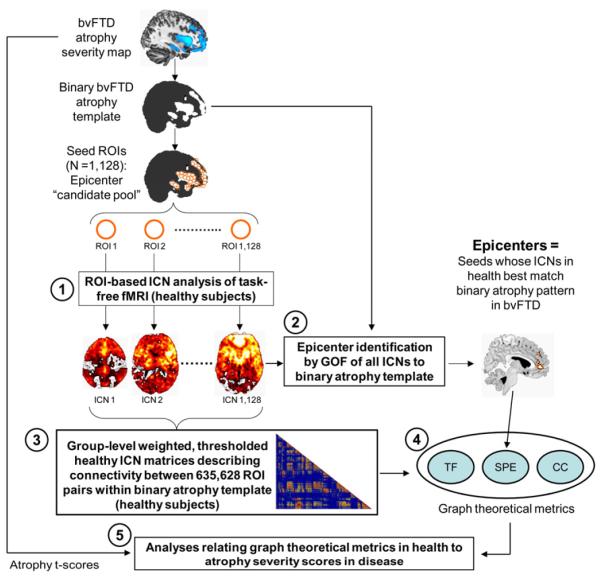
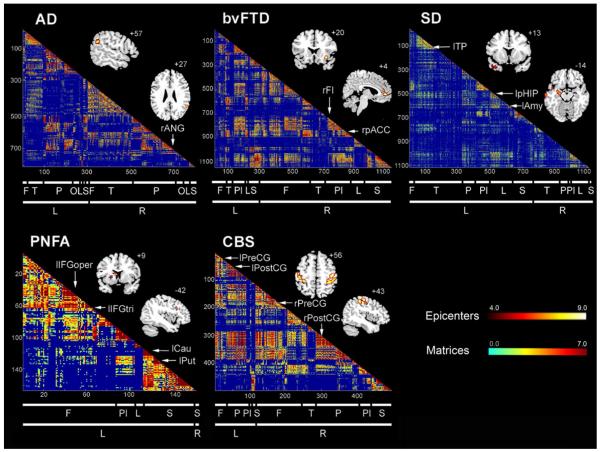
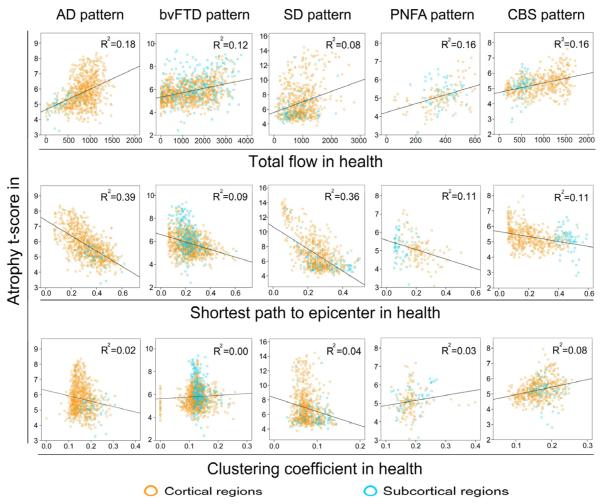
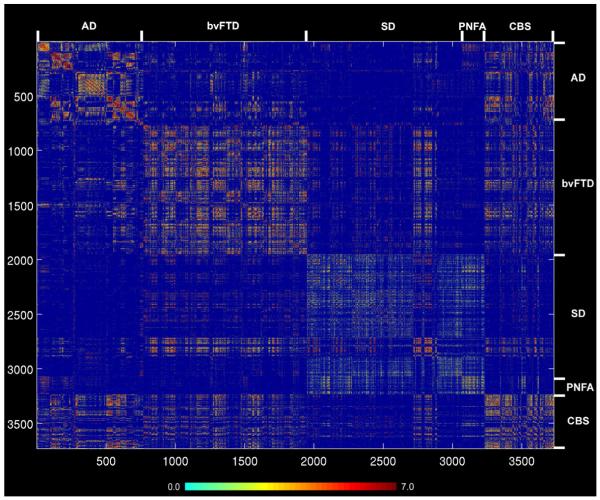
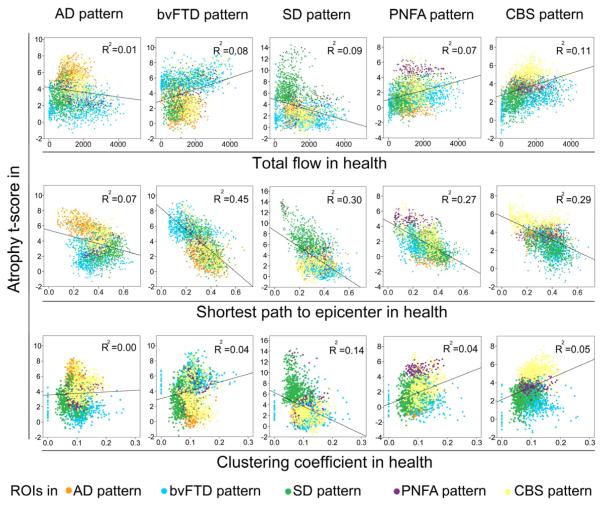
Neurodegenerative diseases target large-scale neural networks. Four competing mechanistic hypotheses have been proposed to explain network-based disease patterning: nodal stress, transneuronal spread, trophic failure, and shared vulnerability. Here, we used task-free fMRI to derive the healthy intrinsic connectivity patterns seeded by brain regions vulnerable to any of five distinct neurodegenerative diseases. These data enabled us to investigate how intrinsic connectivity in health predicts region-by-region vulnerability to disease. For each illness, specific regions emerged as critical network "epicenters" whose normal connectivity profiles most resembled the disease-associated atrophy pattern. Graph theoretical analyses in healthy subjects revealed that regions with higher total connectional flow and, more consistently, shorter functional paths to the epicenters, showed greater disease-related vulnerability. These findings best fit a transneuronal spread model of network-based vulnerability. Molecular pathological approaches may help clarify what makes each epicenter vulnerable to its targeting disease and how toxic protein species travel between networked brain structures.


Figures

Figure 1
Figure 1. Predictions made by network-based degeneration models: effects of healthy intrinsic connectivity graph metrics on atrophy severity in disease
A simplified healthy connectivity graph is shown (far left) for illustration purposes only; circles represent nodes (brain regions), lines represent edges (a connection between two nodes), and edge lengths represent the connectivity strength between nodes, with shorter edges representing stronger connections. The orange node represents an epicenter. Three nodes, labeled as ‘A’, ‘B’, and ‘C’, feature contrasting graph theoretical properties to illustrate predictions made by the network-based vulnerability models (far right). Listed in the center column are the relationships predicted by each model. For example, the transneuronal spread model predicts that nodes with shorter (↓) paths to the epicenter in health will be associated with greater (↑) atrophy severity in disease. Justification for each model’s prediction set is provided in the main text.
Figure 2
Figure 2. Study design schematic
Atrophy maps from five neurodegenerative syndromes were delineated in a previous study (Seeley et al., 2009) and binarized to create five sets of 4 mm-radius spherical ROIs representing an epicenter “candidate pool” for each syndrome. Based on these pools, five steps were involved to infer the relationship between healthy intrinsic functional connectivity and atrophy severity in disease: (1) the intrinsic functional connectivity of each ROI was derived with task-free fMRI data from healthy controls, resulting in one whole-brain ICN map for each ROI; (2) regions whose ICNs in health featured significant goodness-of-fit (GOF) to the binarized parent atrophy map were identified as “epicenters” at the group-level; (3) group-level weighted, thresholded healthy ICN matrices were constructed, describing connectivity between all ROI pairs within the binarized atrophy template; (4) three graph theoretical metrics were calculated from the group-level ICN matrices, including shortest functional path to the epicenters (SPE), total flow (TF), and clustering coefficient (CC); (5) correlation and stepwise regression analyses were employed to examine the relationship between the three graph theoretical metrics in health and atrophy t-scores in disease. This process was carried out for each of five syndromic atrophy patterns; for illustration, the steps used for the bvFTD-related analyses are shown here.
Figure 3
Figure 3. Healthy intrinsic connectivity matrices and network epicenters for each of five neurodegenerative syndrome atrophy patterns
Regions whose healthy ICN showed significant goodness-of-fit (GOF) to each of the five atrophy maps were identified as epicenters, shown here superimposed on the MNI template brain (see Supplemental Table 1). The red-orange color bar represents the t-scores associated with the group-level significance of the epicenter GOF scores. Matrices representing the group-level node pair-wise connectivity strengths were organized from left to right (and top to bottom) in the order of frontal (F), temporal (T), parietal (P), occipital (O), paralimbic (Pl), limbic (L), and subcortical (S) regions. The blue-red color bar represents the intrinsic connectivity between each node pair, defined as the t-score from the thresholded group-level one-sample t-test (see Experimental Procedures). Subthreshold node pair connectivity strengths were colored dark blue and omitted from the matrices.
Figure 4
Figure 4. Intra-network graph theoretical connectivity measures in health predict atrophy severity in disease
Regions with high total connectional flow (Row 1) and shorter functional paths to the epicenters (Row 2) showed significantly greater disease vulnerability (p < 0.05 family-wise-error corrected for multiple comparisons in AD, bvFTD, SD, PNFA, and CBS), whereas inconsistent weaker or non-significant relationships were observed between clustering coefficient and atrophy (Row 3). Cortical regions = blue circles; subcortical regions = orange circles.
Figure 5
Figure 5. Healthy intrinsic connectivity matrix representing all ROI pairwise interactions across the five neurodegenerative syndrome atrophy patterns
Matrices representing the group-level node pair-wise connectivity strengths were organized from left to right (and top to bottom) in the order of AD, bvFTD, SD, PNFA, and CBS regions. Ordering of regions within each disease pattern follows the scheme used in Figure 3. The blue-red color bar represents the intrinsic connectivity strength between each node pair, defined as the t-score from the thresholded group-level one-sample t-test (see Experimental Procedures).
Figure 6
Figure 6. Trans-network graph theoretical connectivity measures in health predict atrophy severity in disease
Row 2: ROIs showing greater disease-related atrophy were those featuring shorter functional paths, in the healthy brain, to the disease-associated epicenters (p < 0.05 family-wise-error corrected for multiple comparisons for AD, bvFTD, SD, PNFA, and CBS). Row 1 and 3: Inconsistent weaker or non-significant relationships were observed between total flow or clustering coefficient and disease-related atrophy.

Comment in

References

    1. Alexander GE, DeLong MR, Strick PL. Parallel organization of functionally segregated circuits linking basal ganglia and cortex. Annual Review of Neuroscience. 1986;9:357–381. - PubMed
    1. Appel SH. A unifying hypothesis for the cause of amyotrophic lateral sclerosis, parkinsonism, and Alzheimer disease. Ann Neurol. 1981;10:499–505. - PubMed
    1. Baker HF, Ridley RM, Duchen LW, Crow TJ, Bruton CJ. Evidence for the experimental transmission of cerebral beta-amyloidosis to primates. Int J Exp Pathol. 1993;74:441–454. - PMC - PubMed
    1. Baker HF, Ridley RM, Duchen LW, Crow TJ, Bruton CJ. Induction of beta (A4)-amyloid in primates by injection of Alzheimer’s disease brain homogenate. Comparison with transmission of spongiform encephalopathy. Mol Neurobiol. 1994;8:25–39. - PubMed
    1. Braak H, Braak E. Neuropathological staging of Alzheimer-related changes. Acta Neuropathol. 1991;82:239–259. - PubMed

Publication types