. 2012 Aug;33(8):1849.e5-18.
doi: 10.1016/j.neurobiolaging.2012.02.014. Epub 2012 Mar 23.

Genetic variants influencing human aging from late-onset Alzheimer's disease (LOAD) genome-wide association studies (GWAS)

Collaborators, Affiliations

Genetic variants influencing human aging from late-onset Alzheimer's disease (LOAD) genome-wide association studies (GWAS)

Hui Shi et al. Neurobiol Aging. 2012 Aug.

Abstract

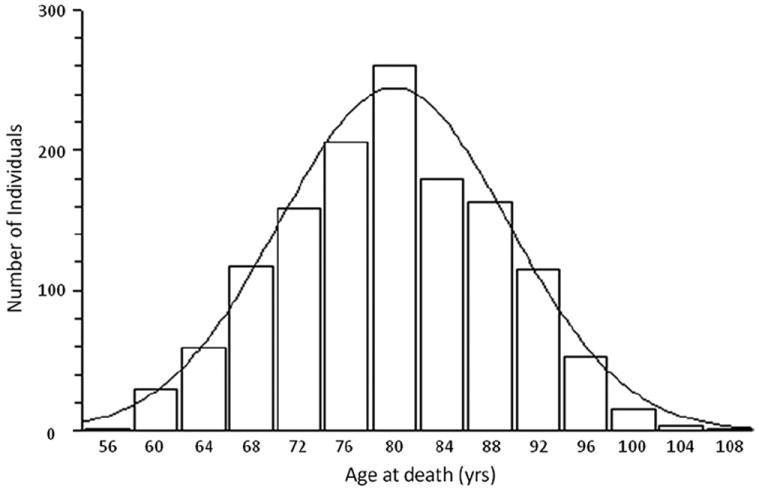
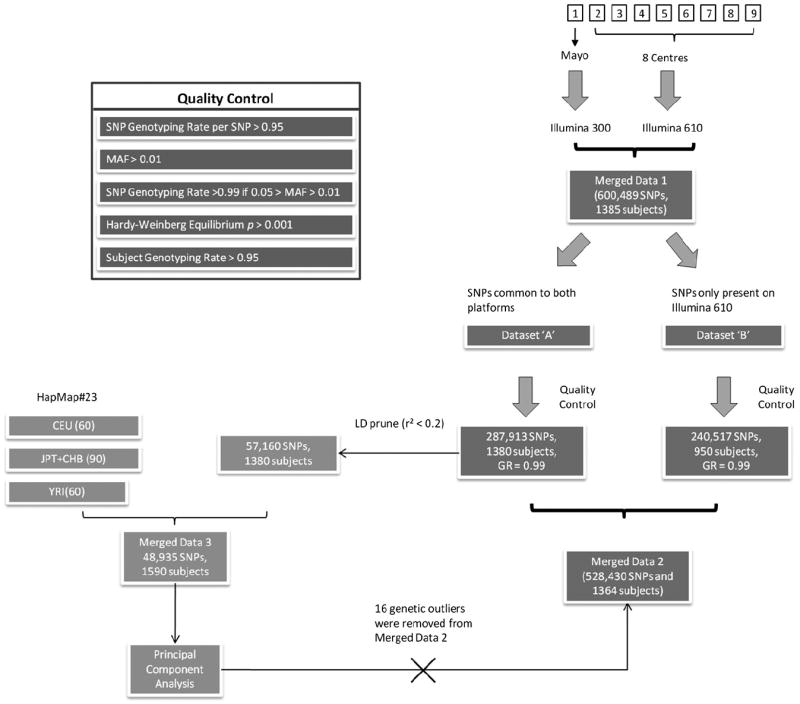
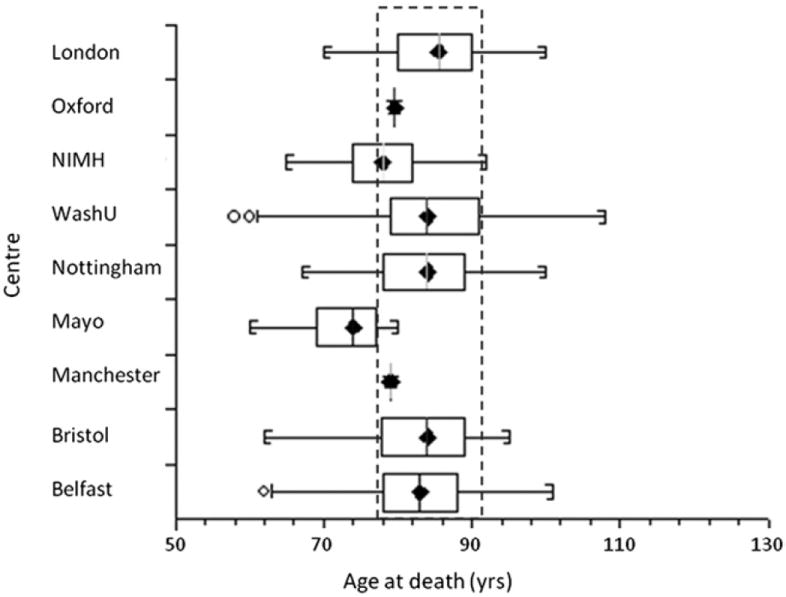
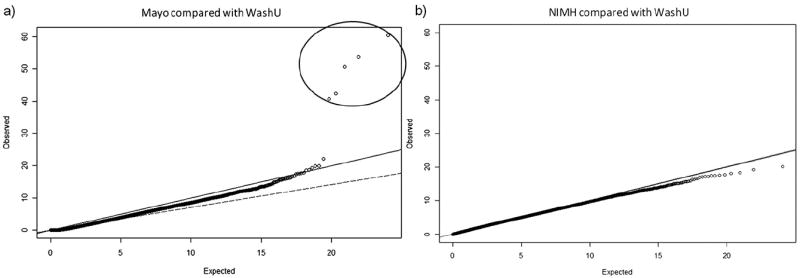
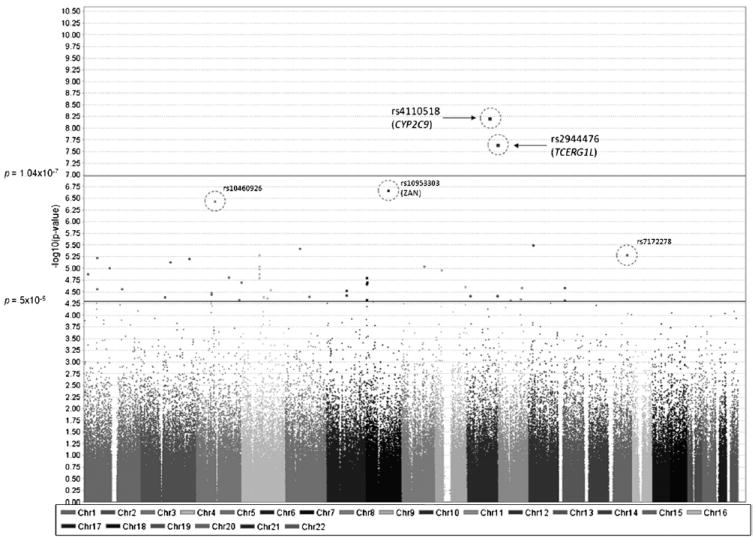
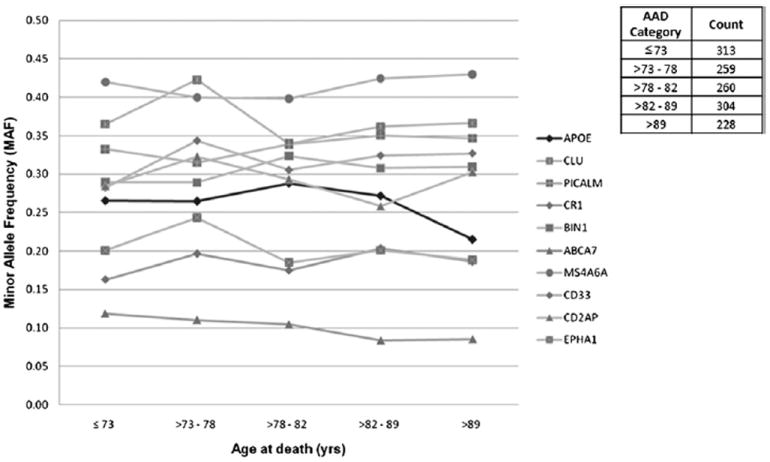
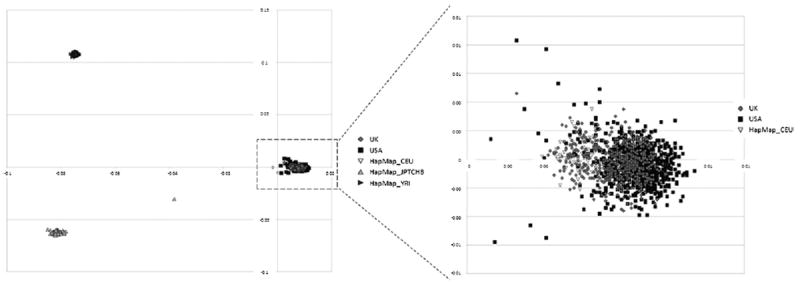
Genetics plays a crucial role in human aging with up to 30% of those living to the mid-80s being determined by genetic variation. Survival to older ages likely entails an even greater genetic contribution. There is increasing evidence that genes implicated in age-related diseases, such as cancer and neuronal disease, play a role in affecting human life span. We have selected the 10 most promising late-onset Alzheimer's disease (LOAD) susceptibility genes identified through several recent large genome-wide association studies (GWAS). These 10 LOAD genes (APOE, CLU, PICALM, CR1, BIN1, ABCA7, MS4A6A, CD33, CD2AP, and EPHA1) have been tested for association with human aging in our dataset (1385 samples with documented age at death [AAD], age range: 58-108 years; mean age at death: 80.2) using the most significant single nucleotide polymorphisms (SNPs) found in the previous studies. Apart from the APOE locus (rs2075650) which showed compelling evidence of association with risk on human life span (p = 5.27 × 10(-4)), none of the other LOAD gene loci demonstrated significant evidence of association. In addition to examining the known LOAD genes, we carried out analyses using age at death as a quantitative trait. No genome-wide significant SNPs were discovered. Increasing sample size and statistical power will be imperative to detect genuine aging-associated variants in the future. In this report, we also discuss issues relating to the analysis of genome-wide association studies data from different centers and the bioinformatic approach required to distinguish spurious genome-wide significant signals from real SNP associations.


Conflict of interest statement

Disclosure statement

The authors declare that there are no conflicts of interest.

Approval was obtained from the ethics committee or institutional review board of each institution responsible for the ascertainment and collection of samples. Written informed consent was obtained for all individuals who participated in this study.

Figures

Fig. 1
Fig. 1
Histogram plot representing the spread of age at death (AAD) of samples included in this study. The x- and y-axis represent AAD in years and number of individuals, respectively. This graph follows a normal distribution, with mean AAD = 80.2 years (n = 1385).
Fig. 2
Fig. 2
Genome-wide association studies (GWAS) data quality control (QC) and data merging strategy. Flow diagram summarizing the processes undertaken for data preparation and QC prior to subsequent analyses. Each GWAS dataset is represented by numbered squares (top right corner). The data were then merged together under PLINK “Consensus call” mode (Merged Data 1). These data were split into 2 groups (Dataset “A” and “B”) according to genotyping rate (single nucleotide polymorphisms [SNPs] which had > 95% genotyping rate for all samples [both chips] and the rest of the SNPs with genotyping rate > 95% for samples typed on the Illumina 610 chip). Both of these groups were subject to QC separately (see Quality Control panel at top left corner). The 2 datasets were then merged (Merged Data 2). Dataset “A” (which contained SNPs common to both platforms) was linkage disequilibrium (LD) pruned and merged with HapMap data (European [CEU], Asian [CHB/JPT], and Yoruba [YRI]) to form “Merged Data 3”. This was then used in a principal components analysis which revealed 16 individuals as genetic outliers. These were removed from “Merged Data 2”. Abbreviation: GR, genotyping rate.
Fig. 3
Fig. 3
Box and whisker plot, showing the age at death (AAD) distribution for each center. The central box represents the distance between the first and third quartiles with the median marked with a diamond. The circles indicate that an individual’s AAD is outside 2 times the interquartile range. The dashed rectangle highlights that the majority of the data have a similar range of AAD with the exception of the National Institute of Mental Health (NIMH) and Mayo data.
Fig. 4
Fig. 4
Q-Q plot of χ2-χ2 p values to determine bias in single nucleotide polymorphism (SNP) frequencies observed in Mayo (a), and National Institute of Mental Health (NIMH) (b) versus Washington University (WashU) data. (a) Logistic regression (Mayo versus WashU samples) adjusted for the top 6 principal components (PCs) and age at death (AAD). Five SNPs (circled) showed significant bias in the Mayo compared with WashU data taking into account population stratification and AAD. (b) Logistic regression comparing NIMH data versus WashU data adjusted for the top 6 PCs and AAD. No bias was observed in NIMH compared with WashU. Solid line represents expected under null hypothesis, i.e., no difference (or no association); open circles represent data points; dashed line the fitted slope of all data points. The diagram was drawn using GenABEL in R (version 2.12.1).
Fig. 5
Fig. 5
Manhattan plot of genome-wide association studies (GWAS) in human aging. Chromosomal position is shown on the x-axis versus -log10 GWAS p value on the y-axis. The threshold for genome-wide significance (p = 1.04 × 10⁻⁷) and p value threshold (p = 5 × 10⁻⁵) are indicated by the horizontal lines. Single nucleotide polymorphisms (SNPs) between these thresholds show “suggestive” associations. The 5 SNPs (highlighted by circles) exhibit significant differences in allele frequencies between samples from Mayo and Washington University (WashU) (see Fig. 4). Two of the 5 SNPs (rs4110518 and rs2944476) showed spurious genome-wide significant signals as a result of this bias.
Fig. 6
Fig. 6
Minor allele frequency (MAF) analysis for 10 late-onset Alzheimer’s disease (LOAD) genes with respect to aging. The figure shows the relationship between single nucleotide polymorphism (SNP) MAFs and human aging, where age at death (AAD) is separated into 5 categories. Each AAD category contains roughly equal amounts of samples to avoid bias in sample sizes. All 10 known LOAD genes are shown together with the APOE locus highlighted in bold (all other loci in gray). The APOE locus (rs2075650) showed significant association with aging, with MAF = 0.27, AAD ≤ 89 years of age (n = 1136), and MAF = 0.21, AAD > 89 years of age (n = 228). None of the other gene loci were significantly associated with aging.
Fig. 7
Fig. 7
Multidimensional scaling (MDS) plot depicting the principal component analysis of Merged Data 3. Population stratification was tested using HapMap data #23 as reference. UK and USA and HapMap CEU samples formed a single cluster (shown inside the dashed rectangle). Up-pointing triangles represent Asian (CHB/JPT) population (bottom left), and right-pointing triangles represent Yoruba (YRI) population (top left). One HapMap individual from the Asian samples appears to have dual ethnicity. The diagram on the right shows a magnified section including UK, USA, and HapMap CEU samples.

References

    1. Arking DE, Atzmon G, Arking A, Barzilai N, Dietz HC. Association between a functional variant of the KLOTHO gene and high-density lipoprotein cholesterol, blood pressure, stroke, and longevity. Circ Res. 2005;96:412–418. - PubMed
    1. Atzmon G, Schechter C, Greiner W, Davidson D, Rennert G, Barzilai N. Clinical phenotype of families with longevity. J Am Geriatr Soc. 2004;52:274–277. - PubMed
    1. Aulchenko YS, Ripke S, Isaacs A, van Duijn CM. GenABEL: an R library for genome-wide association analysis. Bioinformatics. 2007;23:1294–1296. - PubMed
    1. Barrett JC, Fry B, Maller J, Daly MJ. Haploview: analysis and visualization of LD and haplotype maps. Bioinformatics. 2005;21:263–265. - PubMed
    1. Barzilai N, Atzmon G, Schechter C, Schaefer EJ, Cupples AL, Lipton R, Cheng S, Shuldiner AR. Unique lipoprotein phenotype and genotype associated with exceptional longevity. Jama. 2003;290:2030–2040. - PubMed

Publication types

MeSH terms

Substances