. 2012 Apr;122(4):1444-58.
doi: 10.1172/JCI59770. Epub 2012 Mar 26.

Hemoglobin-driven pathophysiology is an in vivo consequence of the red blood cell storage lesion that can be attenuated in guinea pigs by haptoglobin therapy

Affiliations

Hemoglobin-driven pathophysiology is an in vivo consequence of the red blood cell storage lesion that can be attenuated in guinea pigs by haptoglobin therapy

Jin Hyen Baek et al. J Clin Invest. 2012 Apr.

Abstract

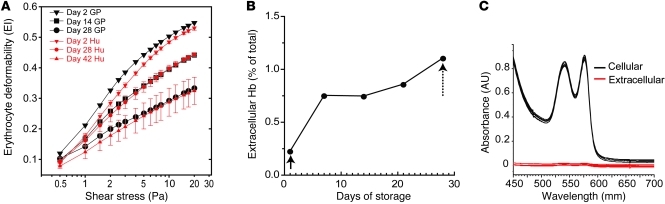
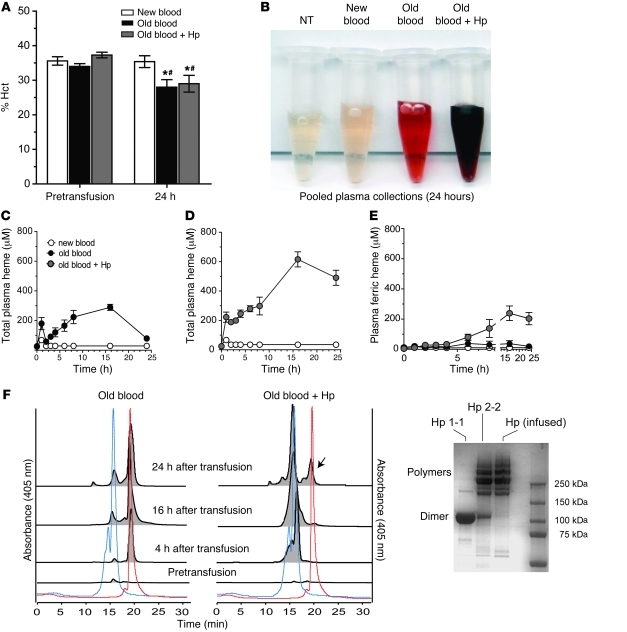
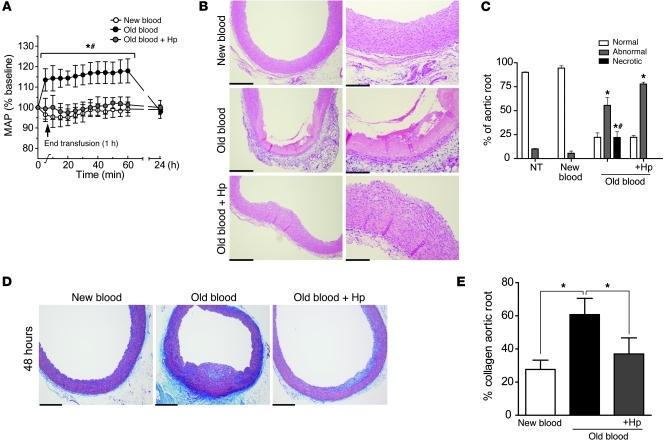
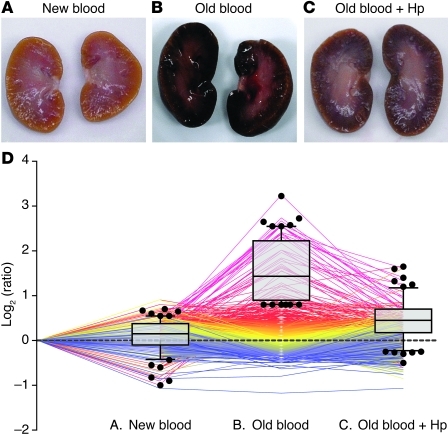
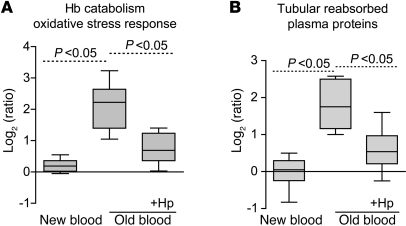
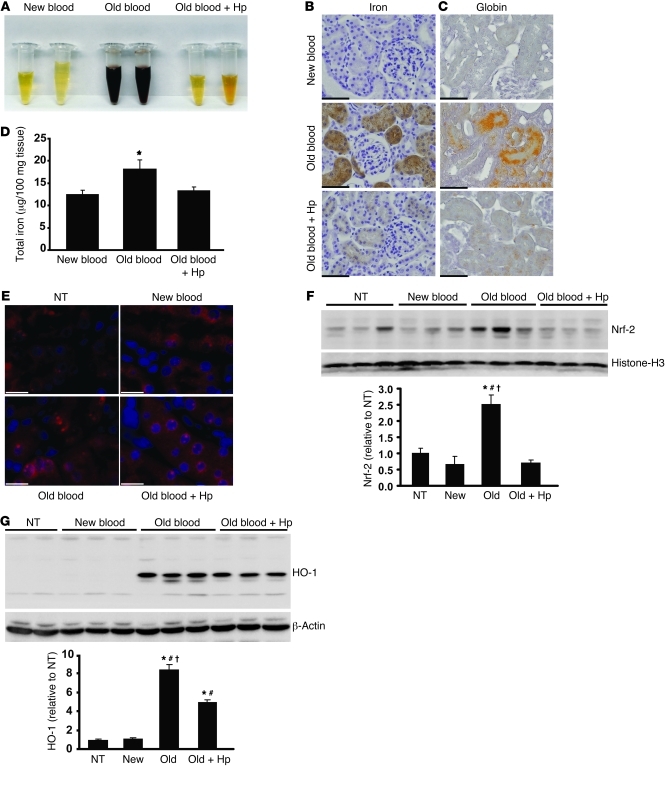
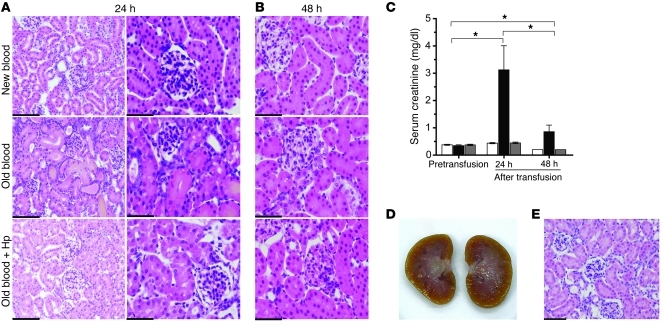
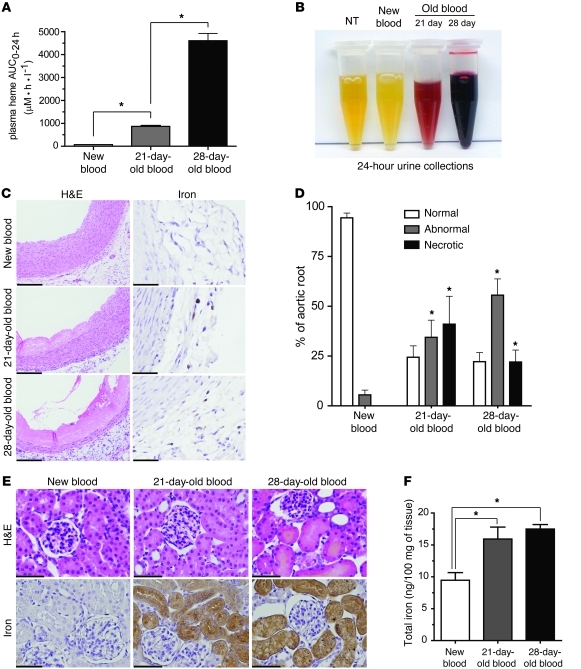
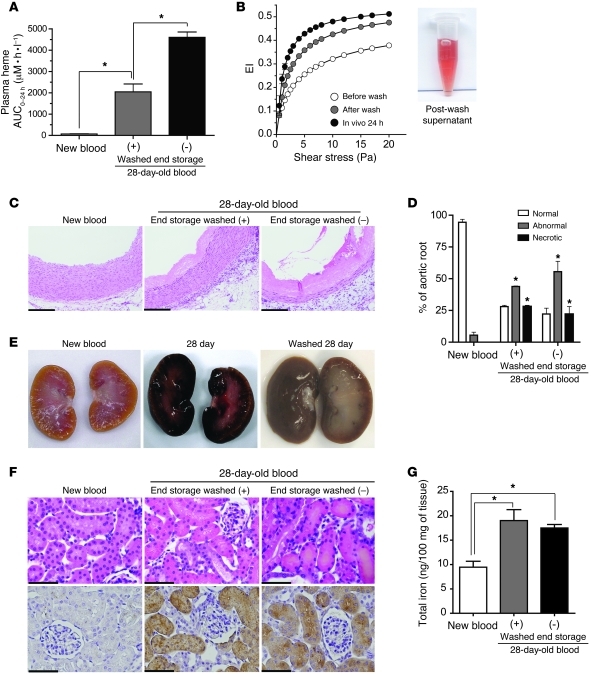
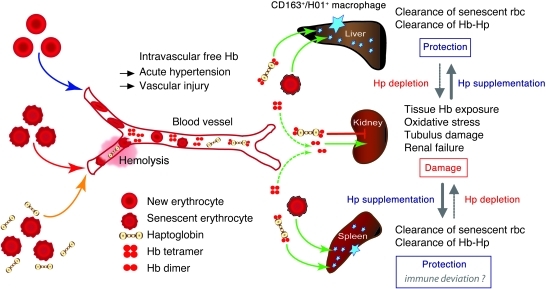
Massive transfusion of blood can lead to clinical complications, including multiorgan dysfunction and even death. Such severe clinical outcomes have been associated with longer red blood cell (rbc) storage times. Collectively referred to as the rbc storage lesion, rbc storage results in multiple biochemical changes that impact intracellular processes as well as membrane and cytoskeletal properties, resulting in cellular injury in vitro. However, how the rbc storage lesion triggers pathophysiology in vivo remains poorly defined. In this study, we developed a guinea pig transfusion model with blood stored under standard blood banking conditions for 2 (new), 21 (intermediate), or 28 days (old blood). Transfusion with old but not new blood led to intravascular hemolysis, acute hypertension, vascular injury, and kidney dysfunction associated with pathophysiology driven by hemoglobin (Hb). These adverse effects were dramatically attenuated when the high-affinity Hb scavenger haptoglobin (Hp) was administered at the time of transfusion with old blood. Pathologies observed after transfusion with old blood, together with the favorable response to Hp supplementation, allowed us to define the in vivo consequences of the rbc storage lesion as storage-related posttransfusion hemolysis producing Hb-driven pathophysiology. Hb sequestration by Hp might therefore be a therapeutic modality for enhancing transfusion safety in severely ill or massively transfused patients.


Figures

Figure 1
Figure 1. In vitro deformability of stored rbc.
(A) Shear stress versus EI plots for guinea pig (GP) rbc collected and stored in CPDA-1/AS-3 at days 2, 14, and 28 of storage. The corresponding plots for human (Hu) cells collected and stored in CPDA-1/SAG-M for 2, 28, and 42 days are shown for comparison. (B) The percentage of free Hb in transfused cell supernatant over storage time. The initial measurements made after leukocyte reduction (solid arrow) and prior to transfusion (dotted arrow) are shown over time and are within the regulatory limits for human transfusion. (C) UV-visible spectra of intracellular and extracellular Hb at day 28 of storage.
Figure 2
Figure 2. In vivo Hb exposure after blood transfusion with or without Hp.
(A) The percentage Hct did not differ among groups immediately prior to transfusion (P > 0.05). Animals transfused with old blood with or without Hp demonstrated small but significantly decreased Hct levels over the 24 hours after transfusion compared with their own groups baseline (*P < 0.05) and new-blood transfusion at 24 hours (#P < 0.05). (B) Aliquot of pooled plasma obtained over the 24-hour collection period. (C) Plasma Hb as total heme concentrations over time compared with new blood. (D) Plasma Hb as total heme after old-blood transfusion plus Hp coinfusion. (E) The contribution of HbFe3+ or met-heme accumulation in plasma over time. The AUC0–24h values are described in the Results, with AUC0–24h for old blood transfusion, with or without Hp, greater than that for new blood (P < 0.05), and AUC0–24h for old blood plus Hp transfusion greater than that for old blood (P < 0.05). (F) Distribution between free Hb and Hp-bound Hb (Hb-Hp complex) in plasma over 24 hours evaluated by size-exclusion chromatography of plasma. The red and blue dotted lines represent Hb and Hb-Hp standards, respectively. Representative samples at 4, 16, and 24 hours indicate free Hb after old-blood transfusion and Hp-bound Hb after old blood plus Hp transfusion. The arrow indicates the presence of free Hb by 24 hours in the old blood plus Hp group. The distribution of standard Hp isoforms 1-1 and 2-2 and infused Hp is shown.
Figure 3
Figure 3. Transfusion-related vascular changes.
(A) Acute mean arterial pressure (MAP) changes observed after transfusion of new, old, and old blood plus Hp. Significant increases in mean arterial pressure were observed after old blood transfusion compared with those after transfusion of new blood and old blood plus Hp, which were not different than basal levels. (B) Vascular changes in H&E-stained sections of the aortic root harvested 24 hours after transfusion. New-blood transfusion at 24 hours indicates no pathological changes, and old-blood transfusion at 24 hours indicates extensive luminal to medial coagulative necrosis, while Hp coinfusion attenuates the effects of old blood. Original magnification, ×200 (B, left); ×400 (B, right). (C) The percentage of normal (white bars), abnormal (gray bars), or necrotic (black bars) aortic root. (D) Abnormal and necrotic regions of the aortic root demonstrated collagen deposits in the vascular wall 48 hours after transfusion. Original magnification, ×100. (E) Old blood had a significantly greater percentage of collagen deposition compared with new and old blood plus Hp. Scale bars (1 cm) = 50 μm (B, left); 25 μm (B, right); 100 μm (D). *P < 0.05; #P < 0.05.
Figure 4
Figure 4. Initial tissue screening — gross pathology and proteomic profiling.
(AC) Gross morphologic changes in kidneys of animals transfused with (A) new blood, (B) old blood, and (C) old blood plus Hp at 24 hours. (D) All proteins that were identified/quantified in at least 2 out of 4 experiments are shown as color-coded lines that represent the relative abundance across the 3 treatment conditions (compared with nontreated [represented by the dotted line]). The proteins that were identified as overrepresented (>2 SD) in animals transfused with old blood are shown in the box plot overlay. Each symbol represents an individual animal. Box plots represent 25%, 50%, and 75% percentiles, horizontal bars represent median values, and whiskers indicate 10% to 90% percentiles.
Figure 5
Figure 5. Renal tissue proteomic analysis.
Quantifications of functional protein categories were extracted from Table 1 and summarized for the different transfusion groups. (A) Cumulative proteins in the category of Hb/heme catabolism and oxidative stress (defined by Nrf-2–activated proteins). (B) Proteins typically filtered and reabsorbed/degraded by renal tubulus cells. In each case, significant (P < 0.05) differences were observed among new blood, old blood, and old blood plus Hp with regard to the designated protein categories. Box plots represent 25%, 50%, and 75% percentiles, horizontal bars represent median values, and whiskers indicate minimum to maximum values.
Figure 6
Figure 6. Renal Hb exposure, metabolic activation, and oxidative stress.
(A) Twenty-four–hour urine collections show hemoglobinuria in the old blood group. (B) Perls iron staining demonstrates regions of iron accumulation, shown as brown, and granular effect in the old blood and, to some extent, old blood plus Hp groups (original magnification, ×400). (C) Okajima’s staining for globin chain deposition after transfusions shows globin chain deposition as orange staining in the renal tubules (original magnification, ×400). (D) Tissue iron quantitation by the ferrozine method indicates a significant (P < 0.05) increase in total iron in kidneys after old blood transfusion compared with that after new blood transfusion. Iron after transfusion with new and old blood plus Hp did not differ from that in NTs. (E) Nrf-2 immunofluorescence at 24 hours after transfusion. Red immunofluorescence within Hoechst-stained blue nuclei indicates nuclear localization of Nrf-2 in old and to some extent old blood plus Hp. These observations were not observed in NTs or new blood–transfused animals kidneys (original magnification, ×600). (F) Nrf-2 nuclear Western blotting indicates a significant (P < 0.05) increase in nuclear Nrf-2 protein compared with that in NT, new blood, old blood plus Hp, and other transfusion groups. (G) HO-1 Western blotting indicates a significant increase in renal HO-1 after transfusion of old blood when compared with that of NTs and animals transfused with new blood and old blood plus Hp after 24 hours. Animals transfused with old blood plus Hp also demonstrated a significant increase (P < 0.05) in HO-1 relative to that in NTs and animals transfused with new blood. Scale bars (1 cm) = 25 μm (B and C); scale bars (6 mm) = 10 μm (E). *P < 0.05; #P < 0.05; P < 0.05.
Figure 7
Figure 7. Renal tubular injury.
(A) H&E-stained kidney tissue at 24 hours after transfusion shows new blood, old blood, and old blood plus Hp at 24 hours after transfusion. Old blood–transfused animal kidneys show distinct regions of proximal and distal tubular dilation and necrosis. These regions are not observed in new blood or old blood plus Hp groups (original magnification, ×200 [left]; ×400 [right]). (B) Recovery of tissue is observed in tissue 48 hours after transfusion (original magnification, ×400). (C) Histopathological events are reflected in serum creatinine, indicating a significant (*P < 0.05) increase 24 hours after old-blood transfusion compared with that after new and old blood plus Hp transfusion. The 48-hour recovery group showed a significant decline (*) in creatinine in serum creatinine. (D and E) The absence of gross and histopathological effects of bolus infusion of free Hb dosed to match the maximal plasma Hb concentration observed with old blood. Scale bars (1 cm) = 50 μm (A, left, and E); 25 μm (A, right, and B).
Figure 8
Figure 8. Cardiorenal response to 21-day-old blood transfusion.
(A) Hb exposure over 24 hours, derived from plasma concentration versus time data as area under the curve (AUC0–24), shows significantly increased Hb exposure after transfusion with 21-day-old and 28-day-old blood compared with that with new blood. (B) The 24-hour urinary Hb excretion after transfusion in guinea pigs. (C) H&E staining of aortic tissue, showing coagulative necrosis in the 21-day-old and 28-day-old blood transfusion groups (original magnification, ×400 [left]). Iron staining of aortic root showing new blood, 21-day-old blood, and 28-day-old blood transfusion groups (original magnification, ×600 [right]). (D) Percentage of normal, abnormal, and necrotic aortic root. Significantly increased abnormal and necrotic regions were observed with transfusion of 21-day-old and 28-day-old blood compared with that with new blood. (E) Iron deposition is shown as brown stained and granular areas. H&E-stained renal cortex in the 3 transfusion groups. Dilated proximal and distal tubules can be seen as swollen tubules with irregular shape, orange-colored casts, and irregular distribution of nuclei after 28-day-old blood transfusion. Perls iron stained renal cortex in the 3 transfusion groups. Original magnification, ×400. Iron deposition is shown as brown stained and granular areas. (F) Iron deposition showing ng iron per 100 mg tissue. 21-day-old blood and 28-day-old blood showed significantly greater iron deposition than new blood. Scale bars (1 cm) = 25 μm (C, H&E, and E); scale bars (6 mm) = 10 μm (C, iron). *P < 0.05.
Figure 9
Figure 9. Cardiorenal response to 28-day-old blood transfusion before and after washing.
(A) Hb exposure over 24 hours (AUC0–24) demonstrated significantly greater Hb exposure after transfusion of 28-day-old blood (with washing) and 28-day-old blood (without [–] washing) compared with that after new blood. (B) The EI of rbc stored for 28 days and measured before and after washes with PBS as well as the EI of blood sampled from guinea pigs at 24 hours after transfusion (n = 4 guinea pigs). The image shows supernatant from 6 washes of 28-day-old rbc. (C) H&E staining of aortic root tissue showing coagulative necrosis in the (washed) 28-day-old blood and (unwashed) 28-day-old blood transfusion groups. Original magnification, ×400. (D) Percentage of normal, abnormal, and necrotic aortic root. Significantly increased abnormal and necrotic regions were observed with transfusion of washed 28-day-old blood and (unwashed) 28-day-old blood compared with new blood. (E) Gross morphology images of kidneys after transfusion of new blood and 28-day-old blood before and after washing. (F) H&E-stained renal cortex. Dilated proximal and distal tubules can be seen as tubules with irregular shape, orange-colored casts, and irregular distribution of nuclei. Perls iron staining is shown as brown granular structures in tubules. Original magnification, ×400. (G) Iron deposition as ng iron per 100 mg tissue. Significantly greater iron deposition versus new blood. Scale bars (1 cm) = 25 μm (C and F). *P < 0.05.
Figure 10
Figure 10. Schematic summary of experimental observations and a proposed mechanistic pathway.
The hypothesis of hemolysis as a major contributor to storage lesion toxicity–associated older storage blood is outlined. This process is hypothesized to be driven by increased rigidity of older storage rbc coupled with large-volume transfusion. In the circulatory compartment, this leads to Hb-associated vascular effects, such as hypertension and direct vascular injury. In high clearance extravascular compartments such as the kidney, injury is driven by Hb exposure, oxidative stress, and acute/chronic renal failure. Hp supplementation via coinfusion with older blood transfusion can (a) prevent renal filtration and (b) redirect clearance to liver and spleen for removal by macrophages. In the circulation, Hp may effectively limit Hb interaction with the vascular wall.

Comment in

References

    1. Koch CG, et al. Duration of red-cell storage and complications after cardiac surgery. N Engl J Med. 2008;358(12):1229–1239. doi: 10.1056/NEJMoa070403. - DOI - PubMed
    1. Purdy FR, Tweeddale MG, Merrick PM. Association of mortality with age of blood transfused in septic ICU patients. Can J Anaesth. 1997;44(12):1256–1261. doi: 10.1007/BF03012772. - DOI - PubMed
    1. Zallen G, et al. Age of transfused blood is an independent risk factor for postinjury multiple organ failure. Am J Surg. 1999;178(6):570–572. doi: 10.1016/S0002-9610(99)00239-1. - DOI - PubMed
    1. Donaldson MD, Seaman MJ, Park GR. Massive blood transfusion. Br J Anaesth. 1992;69(6):621–630. doi: 10.1093/bja/69.6.621. - DOI - PubMed
    1. Haradin AR, Weed RI, Reed CF. Changes in physical properties of stored erythrocytes relationship to survival in vivo. Transfusion. 1969;9(5):229–237. - PubMed

Publication types

MeSH terms