. 2012 Jun 8;419(3-4):171-82.
doi: 10.1016/j.jmb.2012.03.013. Epub 2012 Mar 23.

Substrate-dependent millisecond domain motions in DNA polymerase β

Affiliations

Substrate-dependent millisecond domain motions in DNA polymerase β

Rebecca B Berlow et al. J Mol Biol. .

Abstract

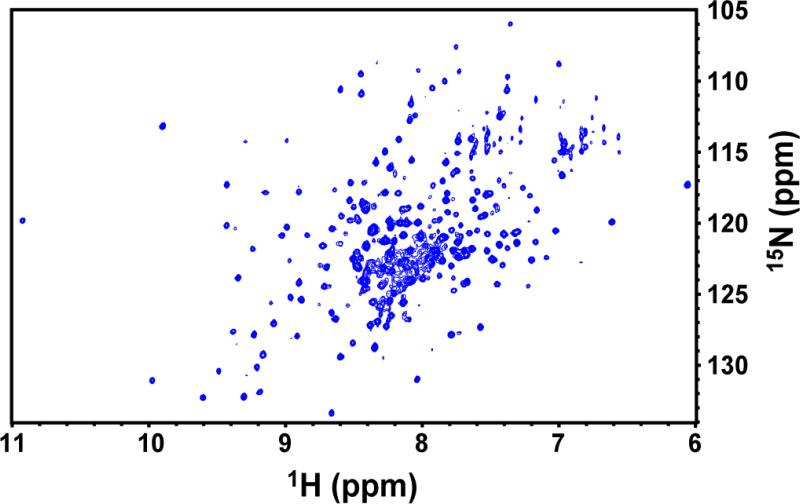
DNA polymerase β (Pol β) is a 39-kDa enzyme that performs the vital cellular function of repairing damaged DNA. Mutations in Pol β have been linked to various cancers, and these mutations are further correlated with altered Pol β enzymatic activity. The fidelity of correct nucleotide incorporation into damaged DNA is essential for Pol β repair function, and several studies have implicated conformational changes in Pol β as a determinant of this repair fidelity. In this work, the rate constants for domain motions in Pol β have been determined by solution NMR relaxation dispersion for the apo and substrate-bound, binary forms of Pol β. In apo Pol β, molecular motions, primarily isolated to the DNA lyase domain, are observed to occur at 1400 s(-1). Additional analysis suggests that these motions allow apo Pol β to sample a conformation similar to the gapped DNA-substrate-bound form. Upon binding DNA, these lyase domain motions are significantly quenched, whereas evidence for conformational motions in the polymerase domain becomes apparent. These NMR studies suggest an alteration in the dynamic landscape of Pol β due to substrate binding. Moreover, a number of the flexible residues identified in this work are also the location of residues, which upon mutation lead to cancer phenotypes in vivo, which may be due to the intimate role of protein motions in Pol β fidelity.


Figures

Figure 1
Figure 1
1H-15N TROSY correlation spectrum of apo Pol β. Data was acquired at 900 MHz using a triple-resonance cryogenically cooled probe. The Pol β sample was at pH = 7.4 and 296 K. Spectral widths in the t1 and t2 dimensions were 3200 Hz and 14500 Hz respectively The data was acquired with 128 points in the t1 dimension and 1000 points in the t2 dimension with 8 scans per t1 point.
Figure 2
Figure 2
Chemical shift changes upon DNA binding. Changes in (A) 1HN, (B) 15NH, and (C) composite 1H and 15N chemical shift changes upon saturation with double-stranded, single-gapped DNA in the presence of 5 mM MgCl2. In (A) and (B) chemical shift changes represent the difference between shifts measured for the apo enzyme and the binary complex (apo – binary). Composite chemical shift differences in (C) were calculated as (δapoHδbinaryH)2+(δapoNδbinaryN)2252 in which δ is the observed chemical shift value. The horizontal line at y = 0.28 represents 1.5σ above the 10% trimmed mean chemical shift change. Select residues with large chemical shift changes are labeled in (C) and those with composite chemical shift changes greater than that indicated by the horizontal bar are shown as blue spheres in (D and E). These residues are shown in blue on two different orientations of the X-ray structure of the binary Pol β complex (PDB ID: 1BPX). The gapped DNA substrate is shown in dark gray.
Figure 3
Figure 3
15N Transverse relaxation rate constants for Pol β. 15N R2,avg values from a TROSY-relaxation compensated CPMG experiment with τcp = 0.625 ms are shown for assigned, resolved amino acid residues in (A) apo and (B) binary Pol β. Residues identified on these graphs are additionally shown in Figure 8 mapped onto the three dimensional structure.
Figure 4
Figure 4. Millisecond motions in apo Pol β
CPMG dispersion curves for residues in apo Pol β. The curves represent global fits of equation 1 to the relaxation data, yielding kex = 1410 s–1.
Figure 5
Figure 5. Location of flexible residues
Amino acid residues in apo Pol β undergoing μs – ms motions as determined by 15N CPMG dispersion experiments are shown as spheres on the structure of the apo enzyme (A and B). For comparison, the location of these residues in the DNA-bound conformation are shown in (C and D). Residues with kex = 1410 s–1 are shown in blue and those with kex > 4000 s–1 are colored red. In (C and D), the gapped DNA strand is shown in gray whereas the template strand is colored black. The apo (PDB ID: 1BPD) and DNA-bound (PDB ID: 1BPX) structures were superimposed based on the C-terminal polymerase domain. Select residues are labeled to orient the reader. Depiction of these flexible residues on the bound structure in (C and D) is not meant to imply they are flexible when Pol β is bound to DNA but simply to highlight the positions they occupy when bound to DNA.
Figure 6
Figure 6. Millisecond motions in the binary complex
The CPMG dispersion curve is shown for E21 in the binary Pol β complex. The inset shows the dispersion curve for E21 in the apo enzyme. Relaxation data for both was acquired at 800 MHz.
Figure 7
Figure 7. Evidence for concerted motions in apo Pol β
Residue-specific Rex values from the relaxation dispersion experiments are plotted against the 15N Δδ2 values corresponding to the differences in the 15N chemical shift between apo and DNA bound Pol β. Blue data points have a linear correlation of 0.94. The red data points, while linearly related (R = 0.65), do not cluster with the blue data and suggest a separate motional process.
Figure 8
Figure 8. Comparison of ms motions in apo and binary Pol β
Amino acid residues undergoing conformational exchange motions on the ms timescale are depicted on the structures of apo and DNA-bound Pol β. (A) Residues showing CPMG dispersion curves (red) and elevated R2 values (blue) in the apo enzyme are shown as spheres at the 15N atomic site. (B) Results for the binary Pol β complex are shown in the same manner as in (A). In (B) the bound, gapped DNA molecule is shown with the gapped strand in gray and the templating strand in black.
Scheme 1
Scheme 1
Structures of Pol β along the reaction coordinate. In (A) the open or apo conformation is shown with the N-terminal lyase domain colored dark gray. In (B) the Pol β-gapped-DNA binary complex is shown with the template DNA strand in magenta and the gapped strands in orange. Panel (C) shows the ternary, Pol β-gapped DNA-AMP-(Mg2+)2 with AMP shown as spheres colored using standard atom colors and the two Mg2+ ions are shown in cyan spheres. From this view the magnesium ions are ‘in-line’ and therefore only one is visible. Panel (D) is an overlay of panels (B) and (C) with the ternary lyase domain colored black. The DNA is removed for clarity but the two Mg2+ ions and nucleotide remain, The C-terminal domains were aligned such that (A) – (D) are shown in the identical orientation.

References

    1. Beard WA, Wilson SH. Structure and mechanism of DNA polymerase Beta. Chem Rev. 2006;106:361–82. - PubMed
    1. Barnes DE, Lindahl T. Repair and genetic consequences of endogenous DNA base damage in mammalian cells. Annu Rev Genet. 2004;38:445–76. - PubMed
    1. Dalal S, Hile S, Eckert KA, Sun KW, Starcevic D, Sweasy JB. Prostate-cancer-associated I260M variant of DNA polymerase beta is a sequence-specific mutator. Biochemistry. 2005;44:15664–73. - PubMed
    1. Dobashi Y, Shuin T, Tsuruga H, Uemura H, Torigoe S, Kubota Y. DNA polymerase beta gene mutation in human prostate cancer. Cancer Res. 1994;54:2827–9. - PubMed
    1. Han LP, Qiao YH, Dong ZM, Shi HR, Zhao GQ, Liu D. [Study on DNA polymerase beta gene mutation in human cervical cancer]. Zhonghua Fu Chan Ke Za Zhi. 2003;38:618–20. - PubMed

Publication types

LinkOut - more resources