. 2012 Jul 16;61(4):1347-54.
doi: 10.1016/j.neuroimage.2012.03.018. Epub 2012 Mar 14.

Individual differences in brain structure underpin empathizing-systemizing cognitive styles in male adults

Collaborators, Affiliations

Individual differences in brain structure underpin empathizing-systemizing cognitive styles in male adults

Meng-Chuan Lai et al. Neuroimage. .

Abstract

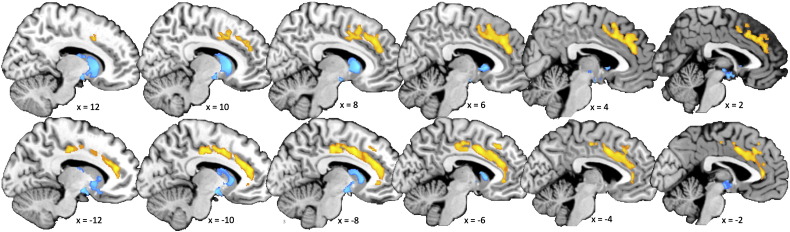
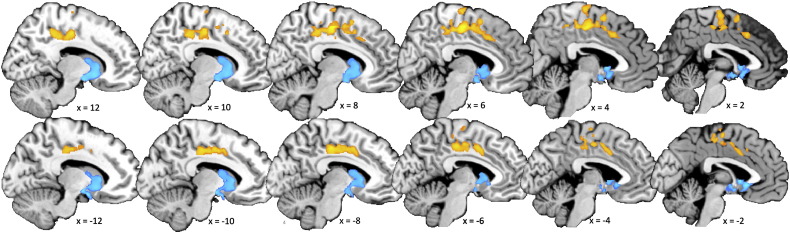
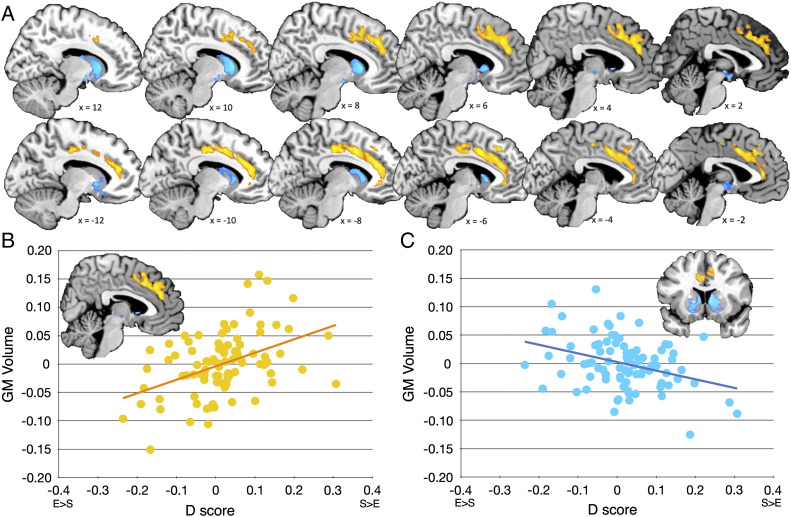
Individual differences in cognitive style can be characterized along two dimensions: 'systemizing' (S, the drive to analyze or build 'rule-based' systems) and 'empathizing' (E, the drive to identify another's mental state and respond to this with an appropriate emotion). Discrepancies between these two dimensions in one direction (S>E) or the other (E>S) are associated with sex differences in cognition: on average more males show an S>E cognitive style, while on average more females show an E>S profile. The neurobiological basis of these different profiles remains unknown. Since individuals may be typical or atypical for their sex, it is important to move away from the study of sex differences and towards the study of differences in cognitive style. Using structural magnetic resonance imaging we examined how neuroanatomy varies as a function of the discrepancy between E and S in 88 adult males from the general population. Selecting just males allows us to study discrepant E-S profiles in a pure way, unconfounded by other factors related to sex and gender. An increasing S>E profile was associated with increased gray matter volume in cingulate and dorsal medial prefrontal areas which have been implicated in processes related to cognitive control, monitoring, error detection, and probabilistic inference. An increasing E>S profile was associated with larger hypothalamic and ventral basal ganglia regions which have been implicated in neuroendocrine control, motivation and reward. These results suggest an underlying neuroanatomical basis linked to the discrepancy between these two important dimensions of individual differences in cognitive style.


Figures

Supplementary Fig. S1
Gray matter correlates of E–S discrepancy expressed by the DZ score. Clusters showing a volumetric correlation with the DZ score (orange for S > E, blue for E > S) were overlaid on a high-resolution anatomical brain image. They were visualized according to the same thresholding criteria for statistical inferences in statistical parametric mapping (SPM) described in the Material and methods section. The results are almost exactly the same as those for the D score.
Supplementary Fig. S2
Gray matter correlates of SQ-R. Clusters showing a volumetric correlation with the SQ-R score (orange for positive correlation, blue for negative correlation) were overlaid on a high-resolution anatomical brain image. They were visualized according to the same thresholding criteria for statistical inferences in SPM described in the Material and methods section.
Fig. 1
Fig. 1
The distribution of D and DZscores. E–S discrepancy was quantified as the difference between standardized measures of systemizing and empathizing. Panels A and B illustrate the distribution of the D and DZ scores, respectively. They were generated from the same raw scores with slightly different standardization strategies; see Material and methods for detail. Both scores, representing dispositional cognitive style, were distributed with large variability and were not significantly deviant from normality.
Fig. 2
Fig. 2
Gray matter correlates of E–S discrepancy. Clusters showing a volumetric correlation with the D score were overlaid on a high-resolution anatomical brain image. They were visualized according to the same thresholding criteria for statistical inferences in statistical parametric mapping (SPM) described in the Material and methods section. Panel A illustrates bilateral midline prefrontal and anterior/middle cingulate structures (marked in orange) whose size was positively correlated with D. Here, a stronger drive to systemize than to empathize was associated with a larger relative regional volume; see panel B. Panel A also illustrates hypothalamus and bilateral ventral basal ganglia (marked in blue) whose size was negatively correlated with D. Here, a stronger drive to empathize than to systemize was associated with a larger relative regional volume; see panel C. In panels B and C, the x-axis represents the D score and the y-axis indicates the residual GM volume of the clusters (i.e., after regressing out centers, total brain volume and age effects). The scatter plots are presented here solely for illustrating the distribution of the data. The size and nature of the correlation displayed should not be used for inference and interpretation on the effect size, as SPM has been used to make the primary inferences.
Fig. 3
Fig. 3
Joint contribution of E and S to the D–GM relationship. These two-dimensional scatterplots illustrate projections onto the E–S plane of the three-dimensional E, S and GM volume scatterplots. Left: positive correlation between D and GM volume in ACC/MCC/paracingulate/dMPFC (Supplementary Movie S1); Right: negative correlation between D and GM volume in ventral basal ganglia/hypothalamus (Supplementary Movie S2). Datapoints are color coded to represent magnitude of residual GM volume (i.e., after regressing out centers, total brain volume and age effects) and the solid line is the E–S plane projection of a linear least-squares regression fitted to the three-dimensional data, which represents the first principal component of this relationship, and indicates its E–S component. Viewing the data in this way allows visualization of the relative contributions of E and S to the D–GM volume relationship. If S was the sole contributor and E made no contribution, the vector would be parallel to the S axis, and vice versa. The diagonal slope indicates that both E and S make joint contributions to the overall D–GM volume relationship.

References

    1. Adolphs R. The social brain: neural basis of social knowledge. Annu. Rev. Psychol. 2009;60:693–716. - PMC - PubMed
    1. Amodio D.M., Frith C.D. Meeting of minds: the medial frontal cortex and social cognition. Nat. Rev. Neurosci. 2006;7:268–277. - PubMed
    1. Arnow B.A., Desmond J.E., Banner L.L., Glover G.H., Solomon A., Polan M.L., Lue T.F., Atlas S.W. Brain activation and sexual arousal in healthy, heterosexual males. Brain. 2002;125:1014–1023. - PubMed
    1. Ashburner J. A fast diffeomorphic image registration algorithm. Neuroimage. 2007;38:95–113. - PubMed
    1. Auyeung B., Wheelwright S., Allison C., Atkinson M., Samarawickrema N., Baron-Cohen S. The children's empathy quotient and systemizing quotient: sex differences in typical development and in autism spectrum conditions. J. Autism Dev. Disord. 2009;39:1509–1521. - PubMed

Publication types