. 2012 Mar 25;18(4):538-46.
doi: 10.1038/nm.2657.

Commensal bacteria-derived signals regulate basophil hematopoiesis and allergic inflammation

Affiliations

Commensal bacteria-derived signals regulate basophil hematopoiesis and allergic inflammation

David A Hill et al. Nat Med. .

Abstract

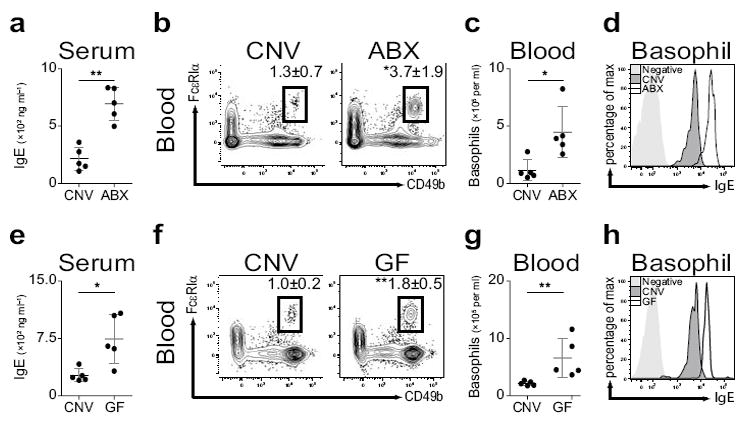
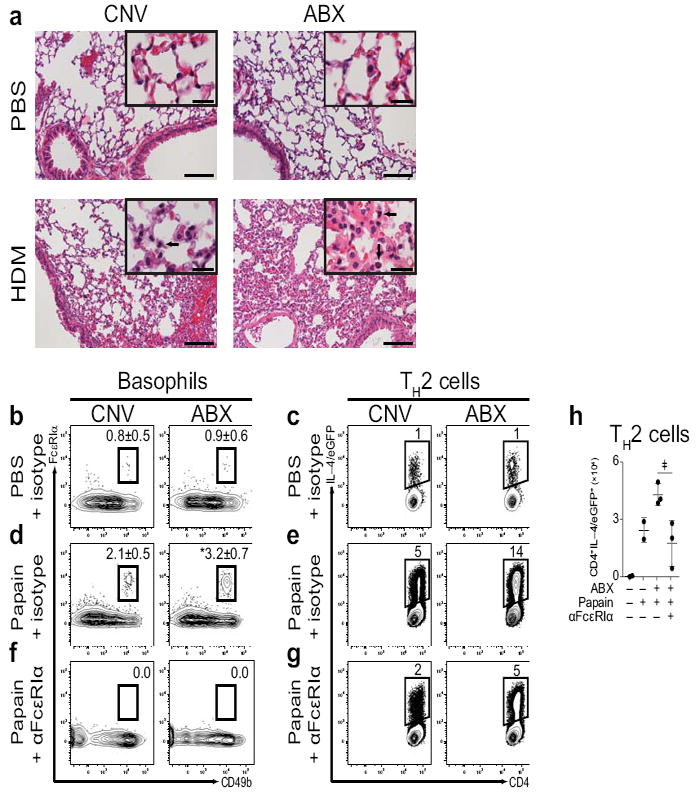
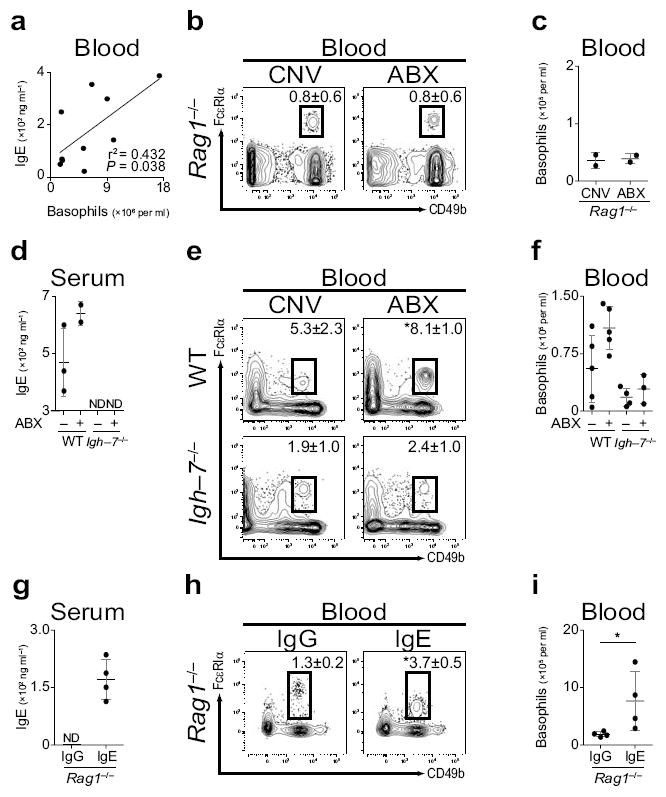
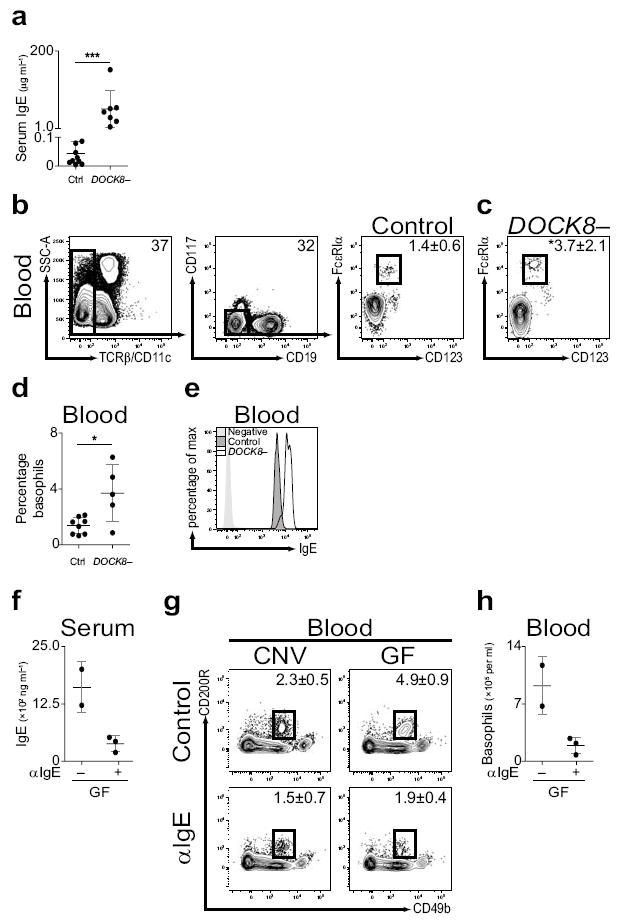
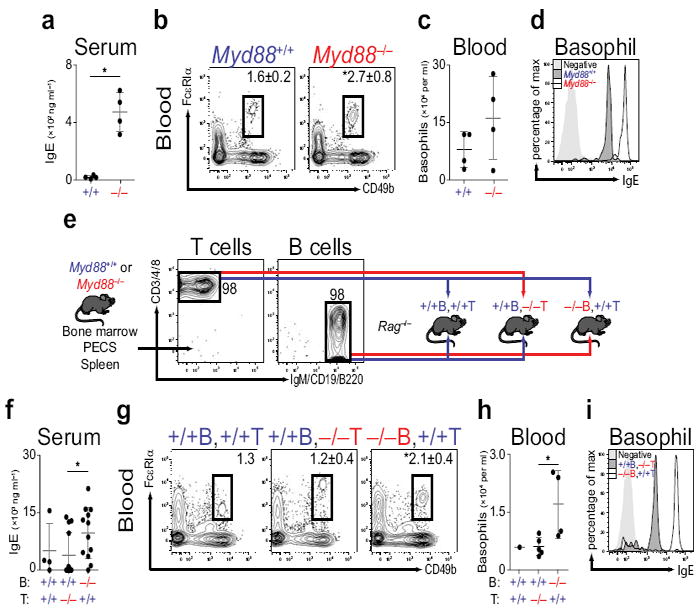
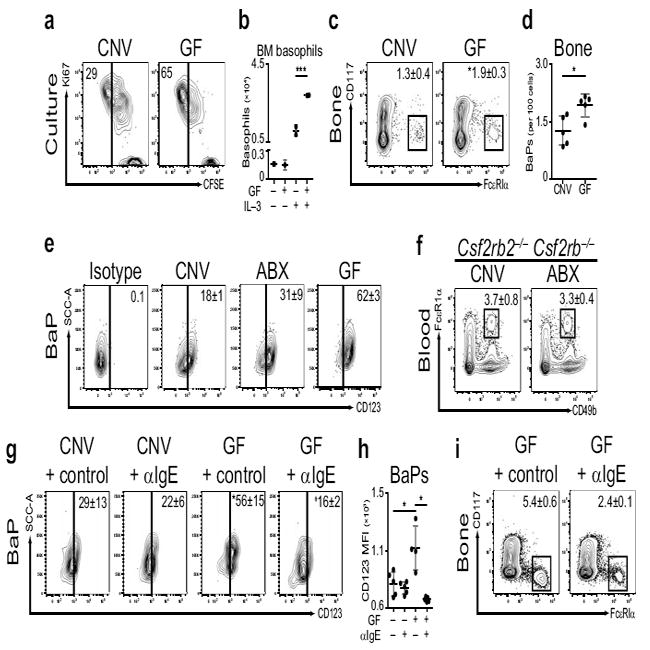
Commensal bacteria that colonize mammalian barrier surfaces are reported to influence T helper type 2 (T(H)2) cytokine-dependent inflammation and susceptibility to allergic disease, although the mechanisms that underlie these observations are poorly understood. In this report, we find that deliberate alteration of commensal bacterial populations via oral antibiotic treatment resulted in elevated serum IgE concentrations, increased steady-state circulating basophil populations and exaggerated basophil-mediated T(H)2 cell responses and allergic inflammation. Elevated serum IgE levels correlated with increased circulating basophil populations in mice and subjects with hyperimmunoglobulinemia E syndrome. Furthermore, B cell-intrinsic expression of myeloid differentiation factor 88 (MyD88) was required to limit serum IgE concentrations and circulating basophil populations in mice. Commensal-derived signals were found to influence basophil development by limiting proliferation of bone marrow-resident precursor populations. Collectively, these results identify a previously unrecognized pathway through which commensal-derived signals influence basophil hematopoiesis and susceptibility to T(H)2 cytokine-dependent inflammation and allergic disease.


Figures

Figure 1
Figure 1
Elevated steady–state serum IgE levels and circulating basophils in antibiotic–treated or germ–free mice. (a) Serum IgE from conventionally–reared (CNV) or antibiotic–treated (ABX) mice as measured by ELISA. (b) Flow cytometric analysis of blood basophils from CNV or ABX mice. Numbers adjacent to outlined areas indicate percent cells in each gate. Gated on CD3, CD4, CD8, CD19, CD117 cells. (c) Number of basophils per ml of blood from CNV or ABX mice. (d) Mean fluorescence intensity of surface–bound IgE on blood basophils from CNV or ABX mice as determined by flow cytometry. (e) Serum IgE from CNV or germ–free (GF) mice as measured by ELISA. (f) Flow cytometric analysis of blood basophils from CNV or GF mice. (g) Number of basophils per ml of blood from CNV or GF mice. (h) Mean fluorescence intensity of surface–bound IgE on blood basophils from CNV or GF mice as determined by flow cytometry. Data representative of three or more independent experiments, results shown as mean ± s.d., significance determined by Mann–Whitney test (CNV, n=5; ABX, n=5; GF, n=5; *, P ≤ 0.05; **, P ≤ 0.01).
Figure 2
Figure 2
Exaggerated basophil–mediated allergic airway inflammation and TH2 cell responses in antibiotic–treated mice. (a) Histological sections of lungs from CNV or ABX mice exposed to PBS or HDM and stained with H&E (Large Bar = 100 μm; Small Bar = 20 μm; Arrows indicate eosinophilic infiltrates; CNV–PBS, n=2; ABX–PBS, n=1; CNV–HDM, n=3; ABX–HDM, n=2). (b) Flow cytometric analysis of day 3 popliteal LN (pLN) basophils from CNV or ABX mice treated with PBS and isotype control antibody. Numbers adjacent to outlined areas indicate percent cells in each gate. Gated on CD3, CD4, CD8, CD19, CD117 cells. (c) Flow cytometric analysis of day 4 pLN IL–4/eGFP+CD4+ TH2 cells from CNV or ABX mice treated with PBS and isotype control antibody. Gated on CD8, CD19, CD4+ cells. (d) Flow cytometric analysis of day 3 pLN basophils from CNV or ABX mice treated with papain and isotype control antibody. (e) Flow cytometric analysis of day 4 pLN IL–4/eGFP+CD4+ TH2 cells from CNV or ABX mice treated with papain and isotype control antibody. (f) Flow cytometric analysis of day 3 pLN basophils from CNV or ABX mice treated with papain and anti–FcεRIα (αFcεRIα) antibody. (g) Flow cytometric analysis of day 4 pLN IL–4/eGFP+CD4+ TH2 cells from CNV or ABX mice treated with papain and αFcεRIα antibody (CNV–PBS–ISO, n=2–5; ABX–PBS–ISO, n=2–5; CNV–PAP–ISO, n=5; ABX–PAP–ISO, n=5; CNV–PAP–αFcεRIα, n=2; ABX–PAP–αFcεRIα, n=2; significance determined by Mann–Whitney test; *, P ≤ 0.05). (h) Number of day 4 pLN IL–4/eGFP+CD4+ TH2 cells from CNV or ABX mice treated with PBS or papain and isotype control (−) or αFcεRIα (+) antibody (means of three experiments ± s.d.; CNV–PBS–ISO, n=4; CNV–PAP–ISO, n=4; ABX–PAP–ISO, n=8; ABX–PAP–αFcεRIα, n=6; significance determined by 2 way ANOVA; ‡, P ≤ 0.06). Data representative of two or more independent experiments, results shown as mean ± s.d.
Figure 3
Figure 3
IgE correlates with circulating basophil populations in mice. (a) Statistical correlation of blood basophil number and serum IgE concentration (significance determined by linear regression analysis; r2 = 0.432; P ≤ 0.038). (b) Flow cytometric analysis of blood basophils from CNV or ABX Rag1−/− mice. Numbers adjacent to outlined areas indicate percent cells in each gate (CNV, n=4; ABX, n=5). Gated on CD3, CD4, CD8, CD19, CD117 cells. (c) Number of basophils per ml of blood from CNV or ABX Rag1−/− mice (CNV, n=2; ABX, n=2). (d) Serum IgE from CNV or ABX wild–type (WT) or Igh–7−/− mice as measured by ELISA (ND, not detected). (e) Flow cytometric analysis of blood basophils from CNV or ABX WT or Igh–7−/− mice (CNV–WT, n=5; ABX–WT, n=5; CNV–Igh–7−/−, n=4; ABX–Igh–7−/−, n=3). (f) Number of basophils per ml of blood from CNV or ABX WT or Igh–7−/− mice (CNV–WT, n=5; ABX–WT, n=5; CNV–Igh–7−/−, n=4; ABX–Igh–7−/−, n=3). (g) Serum IgE levels from IgG or IgE treated Rag1−/− mice as measured by ELISA (IgG, n=4; IgE, n=4; ND, not detected). (h) Flow cytometric analysis of blood basophils from IgG or IgE treated Rag1−/− mice (IgG, n=4; IgE, n=4). (i) Number of basophils per ml of blood from IgG or IgE treated Rag1−/− mice (IgG, n=4; IgE, n=4). Data representative of three or more independent experiments, results shown as mean ± s.d., significance determined by Mann–Whitney test unless otherwise indicated (*, P ≤ 0.05).
Figure 4
Figure 4
Serum IgE levels correlate with circulating basophil populations in human subjects with hyperimmunoglobulinemia E syndrome. (a) Serum IgE levels from control (Ctrl) or subjects with polymorphisms in DOCK8 (DOCK8–) (Ctrl, n=15; DOCK8–, n=7). (b) Identification of blood basophils from control subjects by flow cytometric analysis as TCRβ, CD11c, CD19, CD117, FcεRIα+, CD123+ cells. (c) Flow cytometric analysis of blood basophils from DOCK8– subjects. (d) Frequency of basophils in blood from control or DOCK8– subjects (Ctrl, n=8; DOCK8–, n=5). (e) Mean fluorescence intensity of surface–bound IgE on blood basophils from control or DOCK8– subjects as determined by flow cytometry. (f) Serum IgE from germ–free (GF) mice treated with control (−) or IgE–specific antibody (αIgE; +) antibody as measured by ELISA (control, n=2; αIgE, n=3). (g) Flow cytometric analysis of blood basophils from CNV or GF mice treated with control or αIgE antibody. Numbers adjacent to outlined areas indicate percent cells in each gate (CNV–control, n=2; GF–control, n=2; CNV–αIgE, n=3; GF–αIgE, n=3). Gated on CD3, CD4, CD8, CD19, CD117 cells. (h) Number of basophils per ml of blood from GF mice treated with control or αIgE antibody (control, n=2; αIgE, n=3). Data representative of three or more independent experiments, results shown as mean ± s.d., significance determined by Mann–Whitney test (**, P ≤ 0.01; ***, P ≤ 0.001).
Figure 5
Figure 5
Elevated serum IgE levels and circulating basophil populations in mice lacking B cell–intrinsic MyD88 signaling. (a) Serum IgE from conventionally–reared (CNV) Myd88+/+ (+/+) or Myd88−/− (−/−) mice as measured by ELISA (Myd88+/+, n=4; Myd88−/−, n=4). (b) Flow cytometric analysis of blood basophils from CNV Myd88+/+ or Myd88−/− mice. Numbers adjacent to outlined areas indicate percent cells in each gate (Myd88+/+, n=4; Myd88−/−, n=4). Gated on CD3, CD4, CD8, CD19, CD117 cells. (c) Number of basophils per ml of blood from CNV Myd88+/+ or Myd88−/− mice (Myd88+/+, n=4; Myd88−/−, n=4). (d) Mean fluorescence intensity of surface–bound IgE on blood basophils from CNV Myd88+/+ or Myd88−/− mice as determined by flow cytometry. (e) Experimental diagram of sort and transfer of Myd88+/+ or Myd88−/− B or T cells into Rag1−/− recipients. (f) Serum IgE from Rag1−/− mice reconstituted with Myd88+/+ or Myd88−/− B or T cells as measured by ELISA (+/+B +/+T, n=4; +/+B −/−T, n=12; −/−B +/+T, n=12). (g) Flow cytometric analysis of blood basophils from Rag1−/− mice reconstituted with Myd88+/+ or Myd88−/− B or T cells (+/+B +/+T, n=1; +/+B −/−T, n=5; −/−B +/+T, n=4). (h) Number of basophils per ml of blood from Rag1−/− mice reconstituted with Myd88+/+ or Myd88−/− B or T cells (+/+B +/+T, n=1; +/+B −/−T, n=5; −/−B +/+T, n=4). (i) Mean fluorescence intensity of surface–bound IgE on blood basophils from Rag1−/− mice reconstituted with Myd88+/+ or Myd88−/− B or T cells as determined by flow cytometry. Data representative of three or more independent experiments, results shown as mean ± s.d., significance determined by Mann–Whitney test (*, P ≤ 0.05).
Figure 6
Figure 6
Dysregulated basophil development in germ–free or antibiotic–treated mice. (a) Bone marrow of conventionally–reared (CNV) or germ–free (GF) mice was CFSE labeled, cultured in the presence of IL–3, and basophil populations were examined by flow cytometry. Numbers adjacent to outlined areas indicate percent cells in each gate. Gated on CD3, CD4, CD8, CD19, CD117, CD49b+, FcεR1α+ cells. (b) Bone marrow of CNV (−) or GF (+) mice was cultured in the absence (−) or presence (+) of IL–3 and basophil numbers were determined (means of two experiments ± s.d.; CNV–media, n=5; GF–media, n=3; CNV–IL–3, n=10; GF–IL–3, n=8; significance determined by 2 way ANOVA; ***, P ≤ 0.001). (c) Flow cytometric analysis of BaPs in bone marrow of CNV or GF mice. Gated on CD3, CD4, CD8, CD19, CD34+ cells (CNV, n=5; GF, n=5). (d) Number of BaPs in bone marrow of CNV or GF mice (CNV, n=5; GF, n=5). (e) Frequency of CD123+ BaPs in bone marrow of CNV, antibiotic–treated (ABX) or GF mice as determined by flow cytometry. Gated on CD3, CD4, CD8, CD19, CD117, CD34+, FcεR1α+ cells (CNV, n=2; ABX, n=2; GF, n=2). (f) Flow cytometric analysis of blood basophils from CNV or ABX Csf2rb−/−Csf2rb−/− mice. Gated on CD3, CD4, CD8, CD19, CD117 cells (CNV, n=3; ABX, n=3). (g) Frequency of CD123+ BaPs in bone marrow of CNV or GF mice treated with control or IgE–specific antibody (αIgE) (CNV–control, n=5; CNV–αIgE, n=5; GF–control, n=4; GF–αIgE, n=5; CNV–control vs. GF–control, *, P ≤ 0.05; GF–control vs. GF–αIgE, ‡, P ≤ 0.05). (h) Mean fluorescence intensity of CD123 on BaPs in bone marrow of CNV or GF mice treated with control or αIgE antibody (CNV–control, n=5; CNV–αIgE, n=5; GF–control, n=4; GF–αIgE, n=5; *, P ≤ 0.05). (i) Flow cytometric analysis of BaPs in bone marrow of GF mice treated with control or αIgE antibody (GF–control, n=2; GF–αIgE, n=3). Data representative of two or more independent experiments, results shown as mean ± s.d., significance determined by Mann–Whitney test unless otherwise indicated (*, P ≤ 0.05).

Comment in

References

    1. Eder W, Ege MJ, von Mutius E. The asthma epidemic. N Engl J Med. 2006;355:2226–2235. - PubMed
    1. Bahadori K, et al. Economic burden of asthma: a systematic review. BMC Pulm Med. 2009;9:24. - PMC - PubMed
    1. Mowen KA, Glimcher LH. Signaling pathways in Th2 development. Immunol Rev. 2004;202:203–222. - PubMed
    1. Holgate ST. Pathogenesis of asthma. Clin Exp Allergy. 2008;38:872–897. - PubMed
    1. Vercelli D. Discovering susceptibility genes for asthma and allergy. Nat Rev Immunol. 2008;8:169–182. - PubMed

Publication types

MeSH terms