. 2012 Apr 1;72(7):1773-83.
doi: 10.1158/0008-5472.CAN-11-3831. Epub 2012 Mar 23.

Hypoxia-induced autophagy promotes tumor cell survival and adaptation to antiangiogenic treatment in glioblastoma

Affiliations

Hypoxia-induced autophagy promotes tumor cell survival and adaptation to antiangiogenic treatment in glioblastoma

Yu-Long Hu et al. Cancer Res. .

Abstract

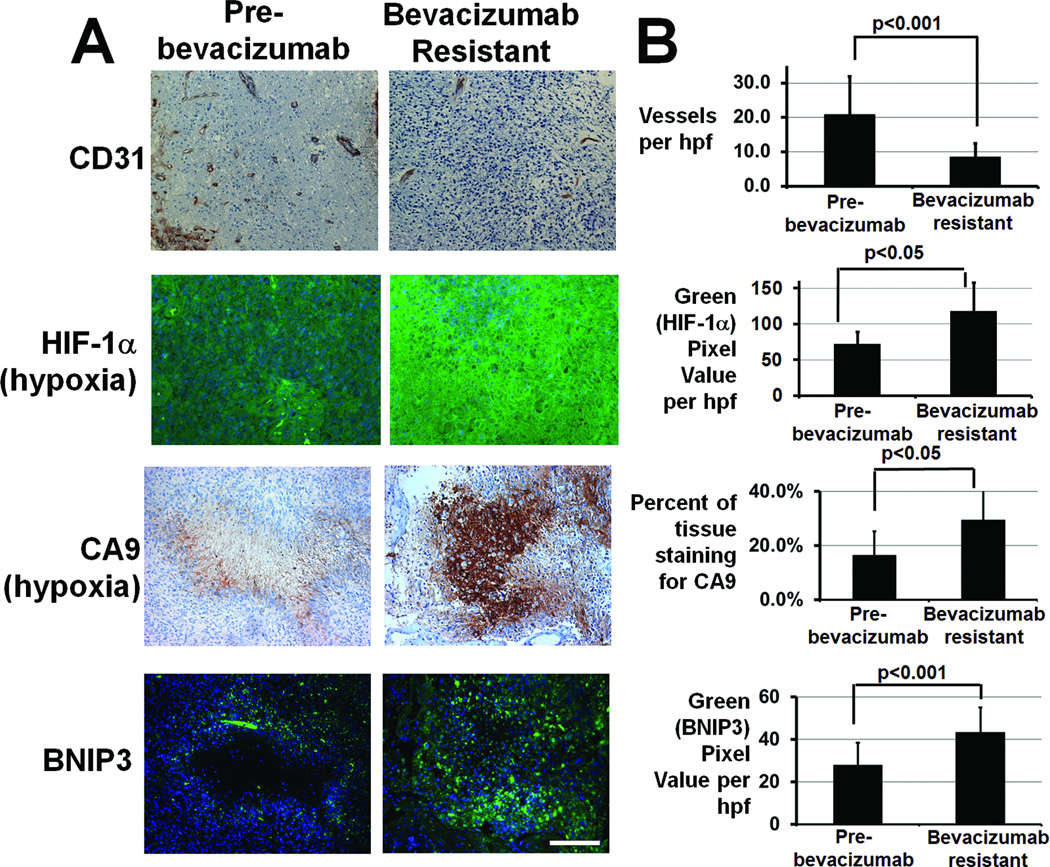
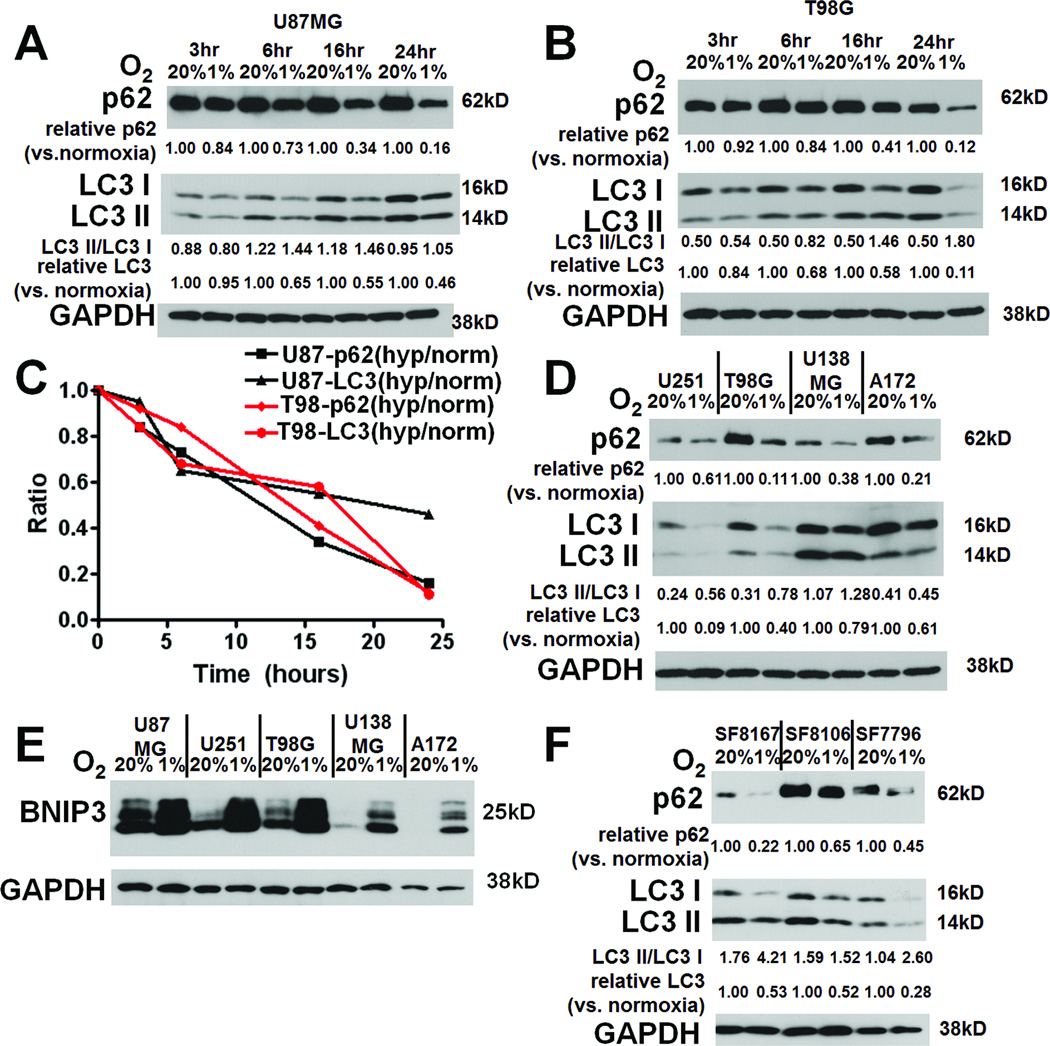
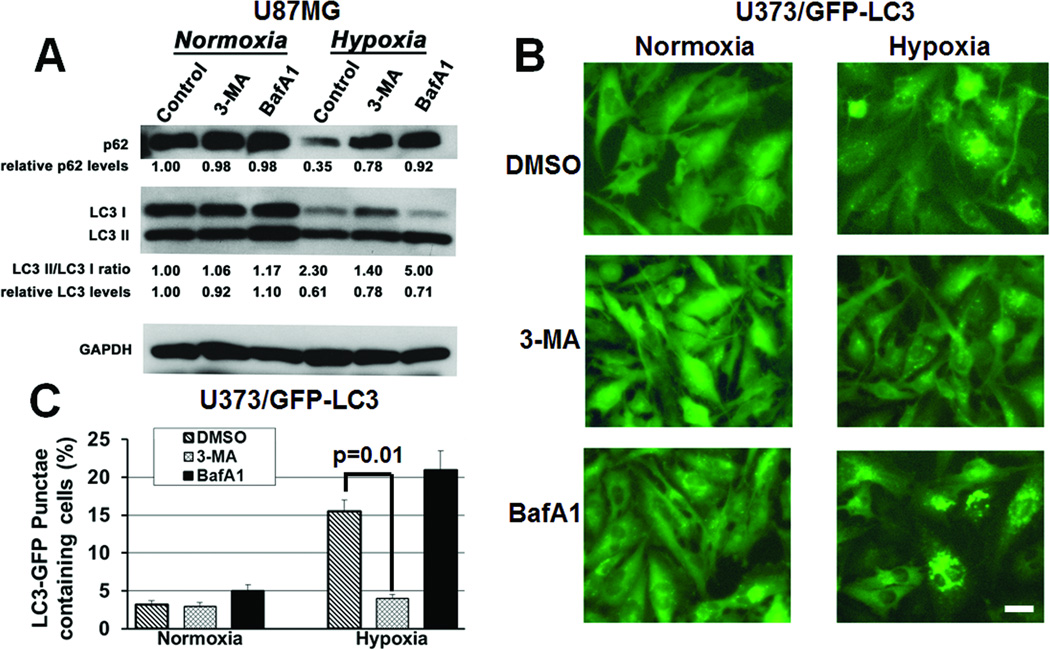
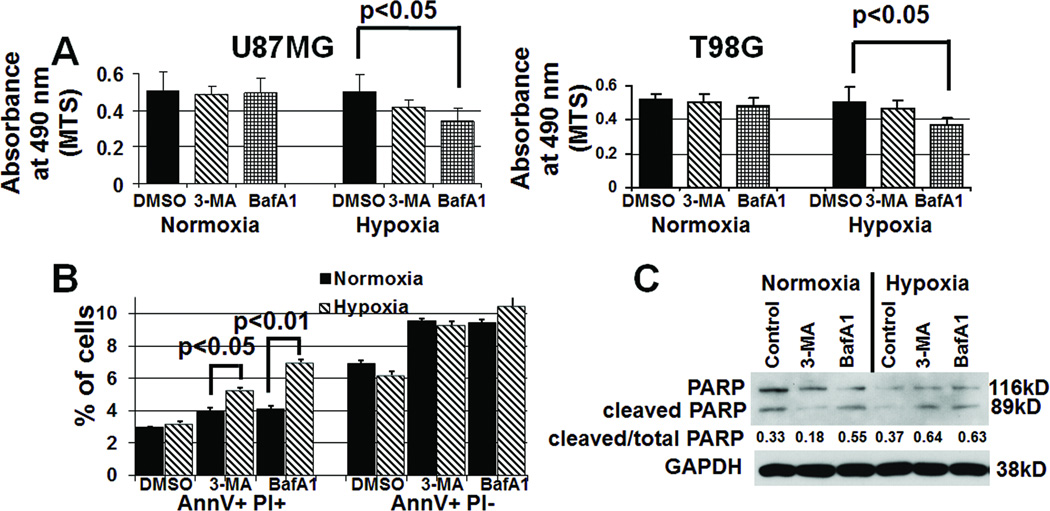
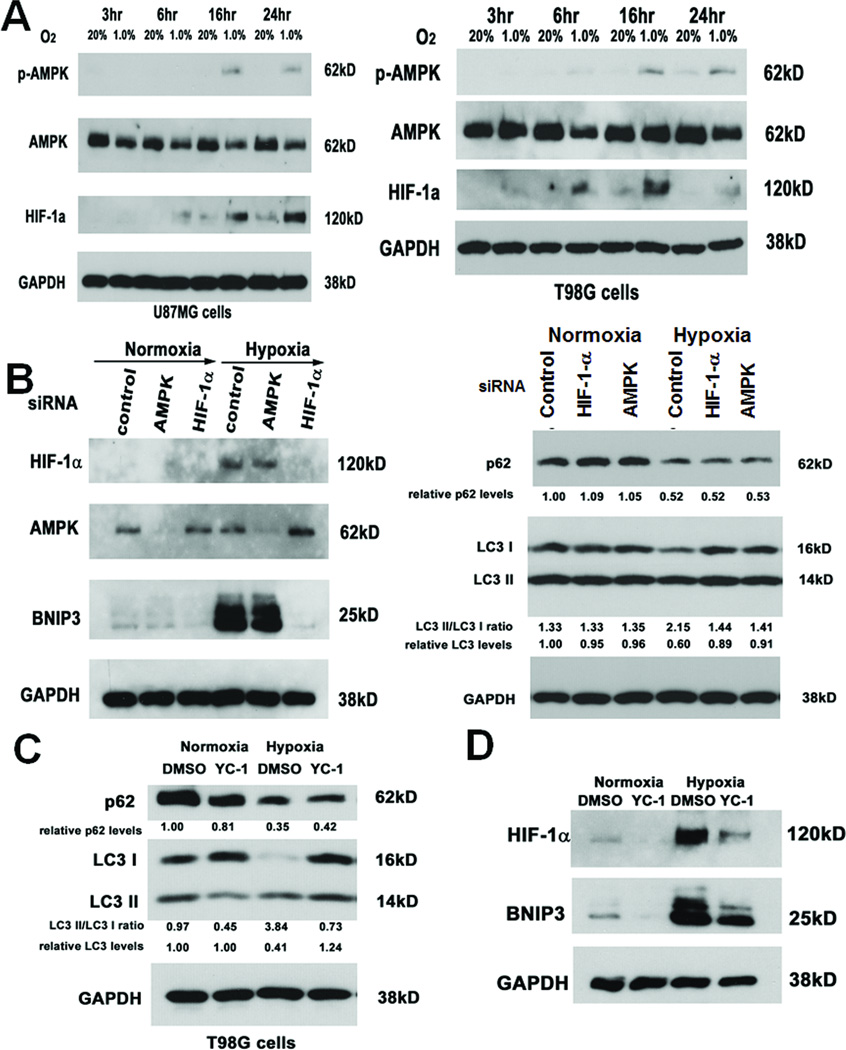
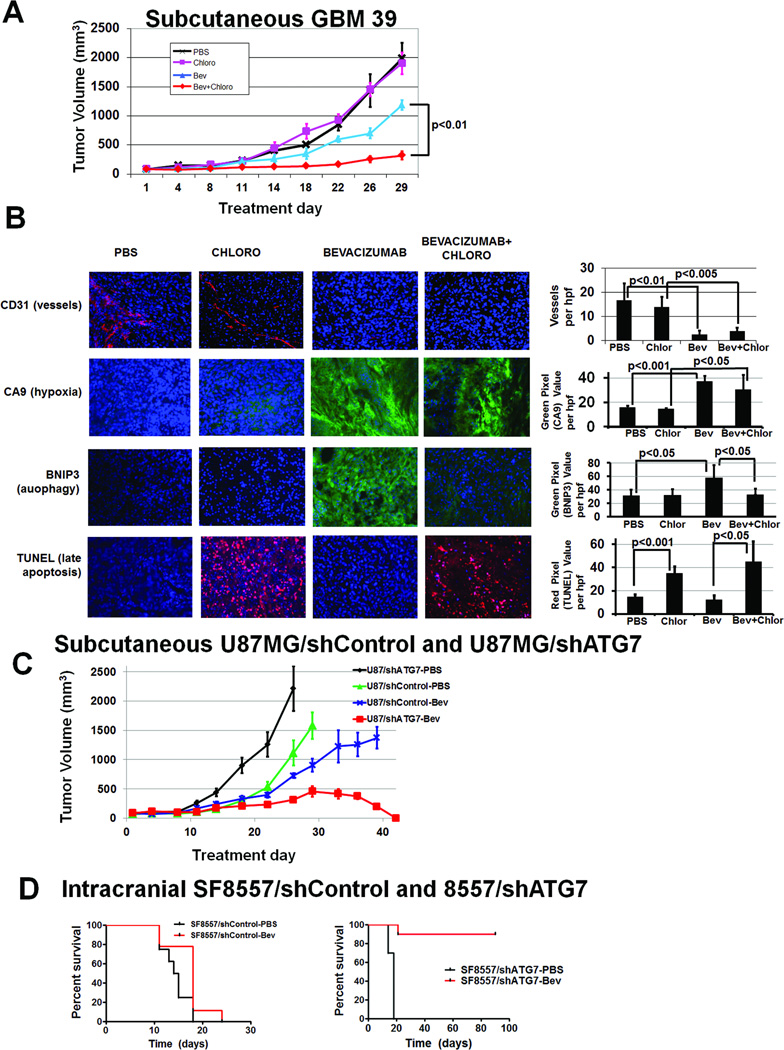
Antiangiogenic therapy leads to devascularization that limits tumor growth. However, the benefits of angiogenesis inhibitors are typically transient and resistance often develops. In this study, we explored the hypothesis that hypoxia caused by antiangiogenic therapy induces tumor cell autophagy as a cytoprotective adaptive response, thereby promoting treatment resistance. Hypoxia-induced autophagy was dependent on signaling through the hypoxia-inducible factor-1α (HIF-1α)/AMPK pathway, and treatment of hypoxic cells with autophagy inhibitors caused a shift from autophagic to apoptotic cell death in vitro. In glioblastomas, clinically resistant to the VEGF-neutralizing antibody bevacizumab, increased regions of hypoxia and higher levels of autophagy-mediating BNIP3 were found when compared with pretreatment specimens from the same patients. When treated with bevacizumab alone, human glioblastoma xenografts showed increased BNIP3 expression and hypoxia-associated growth, which could be prevented by addition of the autophagy inhibitor chloroquine. In vivo targeting of the essential autophagy gene ATG7 also disrupted tumor growth when combined with bevacizumab treatment. Together, our findings elucidate a novel mechanism of resistance to antiangiogenic therapy in which hypoxia-mediated autophagy promotes tumor cell survival. One strong implication of our findings is that autophagy inhibitors may help prevent resistance to antiangiogenic therapy used in the clinic.


Conflict of interest statement

No conflicts of interest to report.

Figures

Figure 1
Figure 1. GBMs progressing during anti-angiogenic therapy exhibit decreased vessel density, increased hypoxia, and increased BNIP3 staining compared to pre-treatment GBMs from the same patients
(A) Representative immunostaining for endothelial marker CD31 (upper row), hypoxia markers HIF-1α (second row; blue=Hoescht nuclear staining; green=HIF-1α), and CA9 (third row), and autophagy-mediating BNIP3 (lower row; blue=Hoescht nuclear staining; green=BNIP3) in this glioblastoma resistant to bevacizumab (right) compared to paired specimens from the same patient before treatment (left). CA9 and BNIP3 stainings are from adjacent sections. (B) Vessel density decreased (P<0.001), hypoxia marker HIF-1α staining increased (P<0.05), hypoxia marker CA9 staining increased (P<0.05), and BNIP3 immunostaining increased (P<0.001) in 6 GBMs after bevacizumab resistance compared to paired pre-treatment specimens. 40x magnification, scale bar=200 µm.
Figure 2
Figure 2. Hypoxia causes autophagy-associated protein changes in GBM cells
Culturing U87MG (A) and T98G (B) GBM cells in hypoxia for up to 24 hours increased, relative to normoxia degradation of p62 and total LC3 (C), with T98G cells also showing increased conversion of LC3-I to LC3-II in hypoxia (B). Similar findings in 3 other glioma cell lines (U251, U138, A172, and G55) are shown at 24 hours (D). All cell lines also showed hypoxia-induced increased expression of autophagy-mediating BNIP3 (E). (F) Culturing primary glioma cells SF8167, SF8106, SF7796, and SF8244 led to the same hypoxia-induced autophagy-associated changes (p62 degradation, LC3-I to LC3-II conversion, and degradation of total LC3) after 24 hours.
Figure 3
Figure 3. Autophagy inhibitors block the hypoxia-induced expression of autophagy mediators in glioma cells
(A) After 24 hours, 3- MA (1 mM) and BafA1 (1 nM) blocked hypoxia-induced p62 degradation in cultured U87MG cells. 3-MA inhibited conversion of LC3-I to LC3-II, while BafA1 increased LC3-I to LC3-II conversion. (B) After 24 hours of hypoxia, U373/GFP-LC3 cells exhibited more punctate green fluorescent staining, consistent with autophagy, which decreased after 3-MA treatment, but remained high after BafA1 treatment. 40x magnification, scale bar=200 µm. (C) 3-MA reduced the percent of cells with over 10 punctate green fluorescent dots (P=0.01).
Figure 4
Figure 4. Inhibiting hypoxia-induced autophagy increases cell death
(A) U87MG and T98G cells in hypoxia for 48 hours exhibited decreased cell numbers, as assessed by absorbance at 490 nm (reflecting number of cells) minus background measured in the MTS assay, when treated with 3-MA (1 mM) or bafilomycin A1 (BafA1; 1 nM) (P<0.05). (B) U87MG cells in hypoxia for 24 hours exhibited an increased percent of AnnexinV+PI+ cells (permeabilized near death cells, leftmost bars) in the presence of 3-MA (P<0.05) or BafA1 (P<0.01) relative to the presence of these inhibitors in normoxia, whilethese inhibitors did not change the percent of AnnexinV+PI cells (early apoptosis, rightmost bars) in hypoxia (P>0.05). (C) Western blotting revealed increased cleavage of PARP, indicating apoptosis, in hypoxic cells treated with 3-MA or BafA1 for 24 hours, suggesting that autophagy inhibitors were promoting apoptosis.
Figure 5
Figure 5. Hypoxia upregulates HIF-1α expression and AMPK phosphorylation, which contribute to some aspects of hypoxia-induced autophagy
(A) U87MG and T98G cells cultured in hypoxia exhibited time-dependent activation of HIF-1α and AMPK (with AMPK activation assessed by detecting phosphorylated AMPK in the first row), with HIF-1α activation occurring before AMPK activation. (B) siRNA-mediated knockdown of AMPK and HIF-1α in hypoxic U87MG cells exhibited reduced LC3-I to LC3-II conversion and reduced total LC3 degradation but neither siRNA affected hypoxia-mediated p62 degradation, while only HIF-1α siRNA reduced hypoxia-induced BNIP3 expression. (C) Similarly, YC-1 (a HIF-1α inhibitor) blocked hypoxia-mediated LC3-I to LC3-II conversion and total LC3 degradation without affecting hypoxia-mediated p62 degradation in T98G cells. (D) In U87MG cells cultured for 24 hours in hypoxia, YC-1 blocked hypoxia-mediated BNIP3 upregulation.
Figure 6
Figure 6. Autophagy inhibitor chloroquine combined with bevacizumab inhibits GBM39 tumor growth in vivo
(A) Subcutaneous tumors in athymic mice were treated with PBS, chloroquine, bevacizumab, and chloroquine plus bevacizumab. After 4 weeks, there was significantly different tumor volumes amongst groups (P<0.05). Compared to PBS (black), neither chloroquine (pink) nor bevacizumab (blue) inhibited tumor growth (P=0.3–0.8). Combined therapy with bevacizumab and chloroquine (red) inhibited tumor growth in a prolonged and statistically significant manner relative to either agent alone (P<0.01 bevacizumab vs. bevacizumab+chloroquine; P<0.005 chloroquine vs. bevacizumab+chloroquine). . (B) Vessel density (CD31 staining, red) decreased in bevacizumab-treated tumors (P<0.01). Hypoxia (CA9 staining, green) increased in bevacizumab-treated tumors (P<0.05). BNIP3 expression (green) increased with bevacizumab treatment (P<0.05), an increase eliminated by adding chloroquine to bevacizumab (P<0.05). TUNEL staining (red) increased in chloroquine-treated tumors (P<0.05). DAPI nuclear counterstaining is blue. Bevacizumab plus chloroquine-treated tumors were small enough that the entire tumor fit one field of view. 20x magnification,. scale bar=200 µm. (C) When subcutaneous U87MG/shControl and U87MG/shATG7 xenografts were treated with PBS or bevacizumab, U87MG/shATG7 tumors completely regressed with bevacizumab treatment (P<0.001), while U87MG/shControl xenografts were minimally responsive (P=0.8). (D) Intracranial SF8557/shATG7 xenografts exhibited 90% long-term survival with bevacizumab treatment, while PBS treatment of intracranial SF8557/shATG7 xenografts led to 18 day median survival (P=0.003). Intracranial SF8557/shControl xenografts exhibited 15 day median survival with PBS, similar to their 18 day median survival with bevacizumab (P=0.3).

References

    1. Jain RK. Lessons from multidisciplinary translational trials on anti-angiogenic therapy of cancer. Nat Rev Cancer. 2008;8:309–316. - PubMed
    1. Vredenburgh JJ, Desjardins A, Herndon JE, 2nd, Dowell JM, Reardon DA, Quinn JA, et al. Phase II trial of bevacizumab and irinotecan in recurrent malignant glioma. Clin Cancer Res. 2007;13:1253–1259. - PubMed
    1. Clark AJ, Lamborn KR, Butowski NA, Chang SM, Prados MD, Clarke JL, et al. Neurosurgical management and prognosis of patients with glioblastoma that progress during bevacizumab treatment. Neurosurgery. 2011 - PubMed
    1. Mazure NM, Pouyssegur J. Hypoxia-induced autophagy: cell death or cell survival? Curr Opin Cell Biol. 2010;22:177–180. - PubMed
    1. Tracy K, Dibling BC, Spike BT, Knabb JR, Schumacker P, Macleod KF. BNIP3 is an RB/E2F target gene required for hypoxia-induced autophagy. Mol Cell Biol. 2007;27:6229–6242. - PMC - PubMed

Publication types

MeSH terms