. 2012;10(3):e1001288.
doi: 10.1371/journal.pbio.1001288. Epub 2012 Mar 20.

Mutations in the mitochondrial methionyl-tRNA synthetase cause a neurodegenerative phenotype in flies and a recessive ataxia (ARSAL) in humans

Affiliations

Mutations in the mitochondrial methionyl-tRNA synthetase cause a neurodegenerative phenotype in flies and a recessive ataxia (ARSAL) in humans

Vafa Bayat et al. PLoS Biol. 2012.

Abstract

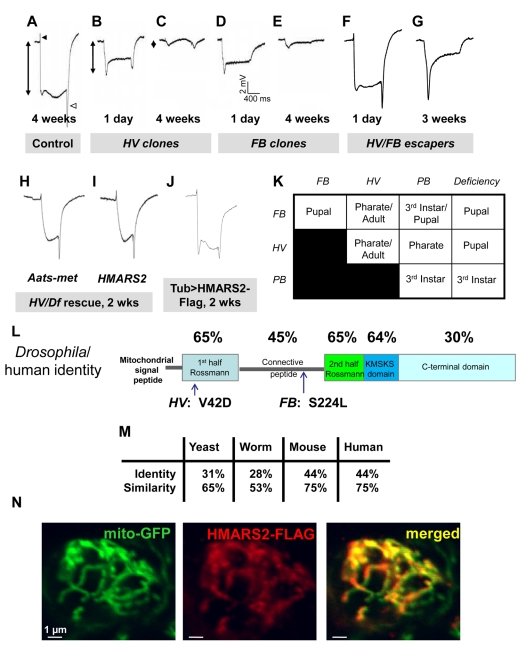
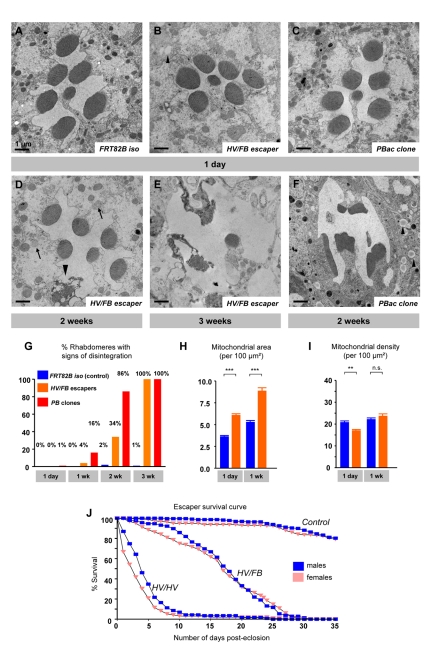
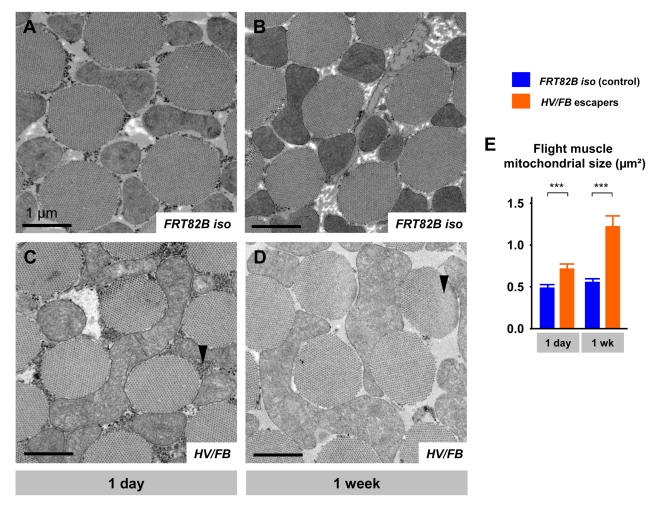
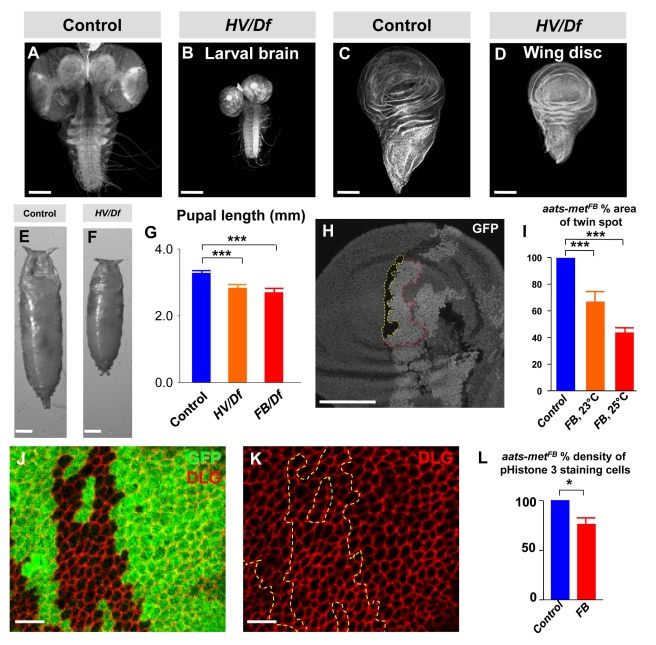
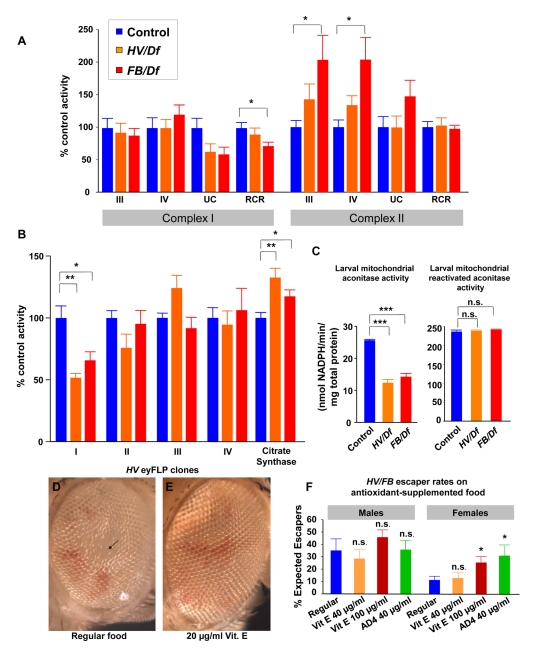
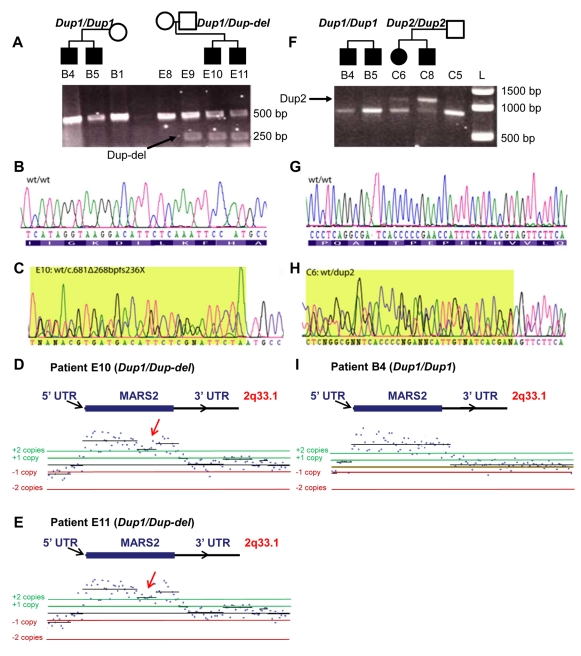
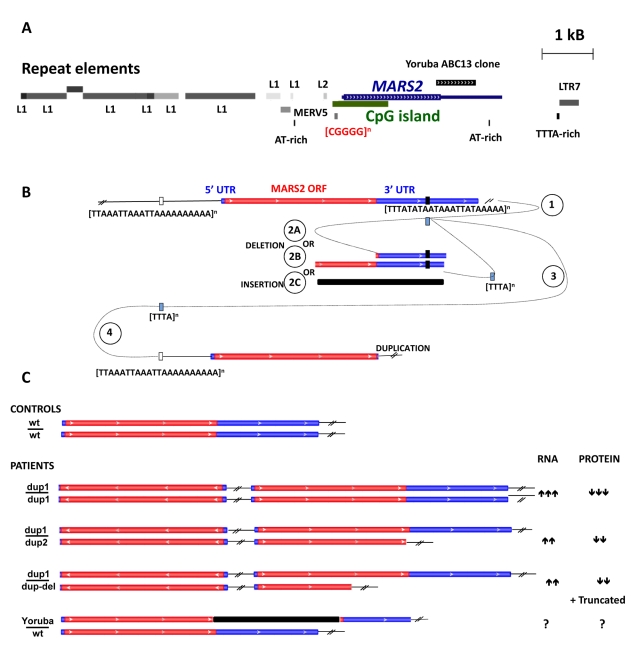
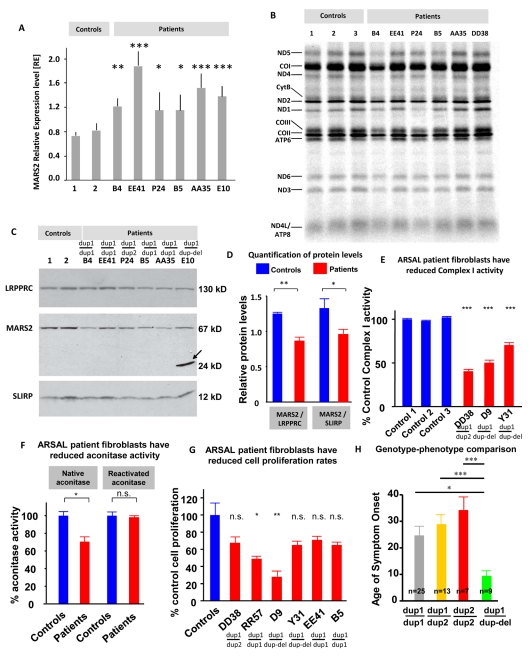
An increasing number of genes required for mitochondrial biogenesis, dynamics, or function have been found to be mutated in metabolic disorders and neurological diseases such as Leigh Syndrome. In a forward genetic screen to identify genes required for neuronal function and survival in Drosophila photoreceptor neurons, we have identified mutations in the mitochondrial methionyl-tRNA synthetase, Aats-met, the homologue of human MARS2. The fly mutants exhibit age-dependent degeneration of photoreceptors, shortened lifespan, and reduced cell proliferation in epithelial tissues. We further observed that these mutants display defects in oxidative phosphorylation, increased Reactive Oxygen Species (ROS), and an upregulated mitochondrial Unfolded Protein Response. With the aid of this knowledge, we identified MARS2 to be mutated in Autosomal Recessive Spastic Ataxia with Leukoencephalopathy (ARSAL) patients. We uncovered complex rearrangements in the MARS2 gene in all ARSAL patients. Analysis of patient cells revealed decreased levels of MARS2 protein and a reduced rate of mitochondrial protein synthesis. Patient cells also exhibited reduced Complex I activity, increased ROS, and a slower cell proliferation rate, similar to Drosophila Aats-met mutants.


Conflict of interest statement

The authors have declared that no competing interests exist.

Figures

Figure 1
Figure 1. Identification/mapping of the Aats-met gene.
(A) ERG of the control (y w; FRT82B iso). The black and white arrowheads indicate the “on” and “off” transients, respectively. The double-pointed arrow indicates the amplitude. (B–C) ERGs of homozygous HV clone-containing flies at 1 d and 4 wk after eclosion. (D–E) ERGs of homozygous FB clone-containing flies at 1 d and 4 wk after eclosion. (F) ERG of a 1-d-old HV/FB escaper. (G) ERG of a 3-wk-old HV/FB escaper. (H) ERG of a 2-wk-old HV/Df fly rescued with actin-Gal4 and UAS-Aats-met. (I) ERG of a 2-wk-old HV/Df fly rescued with actin-Gal4 and UAS-HMARS2. (J) ERG of a 2-wk-old otherwise wild-type fly expressing HMARS2-FLAG driven by tub-Gal4. (K) Lethal stages of homozygous and transheretozygous allelic combinations reveal an allelic series: Df>PB>FB>HV. (L) The Aats-met protein's predicted domains are shown (drawn to scale), with position of mutations and percentage identity compared to human MARS2 shown. (M) The Drosophila Aats-met gene is homologous to the mitochondrial methionyl-tRNA synthetase genes of S. cerevisiae, C. elegans, M. musculus, and H. sapiens. (N) Colocalization of the Flag-tagged human MARS2 protein with Mito-GFP in the cell body of a neuron in the ventral nerve cord, driven by the D42-Gal4 driver, is shown.
Figure 2
Figure 2. Retinal degeneration and lifespan of Aats-met mutants.
(A) TEM of a single ommatidium from a control 1-d-old fly eye, showing the characteristic seven dark rhabdomeres in the center. (B) TEM of a single ommatidium from the eye of a 1-d-old HV/FB escaper fly, showing no obvious defects. (C) TEM of the eye of a 1-d-old fly containing homozygous clones of a PB allele. (D) TEM of the eye of a 2-wk-old HV/FB escaper fly, showing the beginning of a neurodegenerative process, with a degenerating rhabdomere (arrowhead) and enlarged mitochondria (arrow). (E) TEM of the eye of a 3-wk-old escaper. (F) A neurodegenerative process is evident in clones of the PB allele in a 2-wk-old fly. Arrows indicate lipid droplets in pigment cells (arrowheads). (G) Quantification of 100 retinal photoreceptor rhabdomeres for the control, HV/FB escapers, and PB clone-containing mutants at different ages. (H) Quantification of the total mitochondrial area as a percentage of the retinal area: HV/FB mutants clearly have a higher mitochondrial content. (I) Quantification of average mitochondrial size, showing the mitochondrial number of the HV/FB mutant retinas (n = 50). (J) Graph showing the shortened lifespans of 100–200 HV/FB and HV/HV escapers of each gender compared to controls, with males denoted in blue and females in pink. Scale bars: 1 µm.
Figure 3
Figure 3. TEM of indirect flight muscle.
(A) TEM micrograph of 1-d-old control (FRT82B isogenized) flight muscle, with its characteristic myofibers surrounded by mitochondria and small glycogen granules. (B) Micrograph of 1-wk-old control muscle. (C) Micrograph of 1-d-old HV/FB escaper, with much larger mitochondria with poor cristae structure, and a high density of granules compared to control (arrowhead). (D) 1-wk-old escaper flight muscle, with a similar but more severe mitochondrial phenotype and a complete absence of granules. Myofibril degeneration is highlighted by the arrowhead. (E) Quantification of the average mitochondrial size between control (blue) and HV/FB (orange) escaper flight muscle, showing much larger mitochondria present in the mutants. Scale bars: 1 µm.
Figure 4
Figure 4. Aats-met mutants have reduced cell proliferation.
(A–B) Brains of late 3rd instar control and HV/Df larvae stained with Rhodamine-Phalloidin. (C–D) Wing discs of a late 3rd instar control and mutant larvae stained with Rhodamine-Phalloidin. (E–F) Control and mutant pupae are shown. (G) Quantification of pupal length is shown. (H) Wing disc containing wild-type (outlined in yellow) and mutant clones (outlined in red) are seen. (I) Wild-type clones are significantly larger than mutant clones, quantified in 16 to 20 pairs of clones. (J–K) Cells in mutant clones in wing discs, stained with anti-Dlg, to mark the cell membrane, are similar in size to wild-type cells. (L) PH3-staining cells in mutant versus neighboring heterozygous tissue is quantified for five wing discs, indicating that there is less cell proliferation in mutant clones. Data are mean ± s.e.m. Scale bars for (A–D) and (H) are 100 microns, (E–F) are 0.3 mm, and (J–K) are 5 microns.
Figure 5
Figure 5. Aats-met mutants exhibit a complex I deficiency and phenotypes can be suppressed with antioxidants.
(A) Polarography (measurement of substrate-dependent O2 consumption of isolated 3rd instar larvae-derived mitochondria given needed substrates) was performed in the presence of Complex I–specific substrates or Complex II–specific substrate. State III is the ADP-stimulated oxygen consumption rate; state IV is the ADP-limited oxygen consumption rate; UC is the oxygen-consumption rate in the presence of an uncoupler; RCR is the Respiratory Control Ratio (state III rate/state IV rate). (B) Individual respiratory chain activities were measured from disrupted mitochondria. Mutant mitochondria exhibit partial deficiency of complex I as well as an increase in CS activity. Data are expressed as percentage control activity (mean ± s.e.m.). (C) Purified disrupted mitochondrial extracts from control 3rd instar, HV/Df, and FB/Df larvae were quantified for aconitase activity, showing a significant decrease resulting from oxidation in the mutants. Treatment with reducing agent resulted in normal activity levels, indicating that the difference was not due to lower levels of aconitase but from increased oxidized aconitase. (D–E) Aats-metHV eyes often exhibit glossy areas in the middle of large clones (arrow). In addition, the eyes are typically smaller. With 20 µg/ml Vitamin E, there is significant improvement in eye morphology and size (p<0.001). (F) Mutant escaper rates are increased for females supplemented with antioxidants. Male escaper rates are already high, even without antioxidants. Three different drug supplementation regimens were used. For the female escaper rate, the last two drug regimens produced a significant improvement. Data are mean ± s.e.m.
Figure 6
Figure 6. The human MARS2 mutations.
(A) PCR amplification products of MARS2 encompassing a portion of the coding sequence revealed the presence of a 268 bp deletion mutation segregating in ARSAL Family E but not in Family B. This truncated product is indicated by an arrow. The normal PCR product is around 500 bp. Segregation of the deletion is shown in Family E; brothers E10 and E11 carry the mutation. Their unaffected father E9 is also a carrier. The determined genotypes for the patients shown (summarized in Table S5 for all patients) are shown above the PCR bands. (B) Wild-type sequence of MARS2 PCR products. (C) DNA sequencing of the deletion (c.681Δ268bpfx236X). (D–E) Nonrecurrent rearrangements involving the MARS2 gene was confirmed by the oligonucleotide custom aCGH. In patients E10 and E11, the array discriminated the presence of the duplication as well as the deletion (see arrows) as depicted by the lower band detecting only one additional copy. (F) PCR amplification products of MARS2 encompassing the coding sequence revealed the presence of a ∼300 bp insertion mutation segregating in ARSAL family members C6 and C8 but not in Family B. This larger amplification product is indicated by an arrow. The normal amplicon size is about 800 bp. C5 is the unaffected father of C6 and C8 and also carries the mutation. (G) Wild-type sequence of MARS2. (H) DNA sequencing of the heterozygous case C6 corresponding to the insertion revealed parts of the MARS2 duplication mutation. Rearrangement was confirmed by oligonucleotide custom aCGH. Note that the array data of C6, a compound heterozygote (Dup2/Dup2), demonstrates the presence of a potentially larger duplication while not showing the 300 bp insertion, the array not having been designed to include its sequence. (I) In homozygous patient B4 (Dup1/Dup1), the array suggests that the duplication has identical distal and proximal breakpoint junctions with the other ARSAL cases.
Figure 7
Figure 7. Schematic representation of the MARS2 region and ARSAL mutations.
(A) Schematic representation of the chromosome 2q33.1 locus containing the mitochondrial methionyl-tRNA synthetase sequence (based on the UCSC genome browser). MARS2 is an intronless gene located within the intronic sequence of a noncoding mRNA (BC021693). Its CpG island encompasses much of its coding sequence. Human Genome Structural Variation Project data show the insertion of a 726 bp discordant clone (ABC8_43216400 E17, Yoruba sample) containing a 276 bp LINE sequence (L2) within the coding sequence of the MARS2 gene. DNA of this clone is depicted as a black box below the MARS2 ideogram. Interestingly, the clone insertion fragment is located within the same distal junction breakpoint of ARSAL CNVs. (chr2: 198,280,073–198,280,860). No polymorphic CNV, structural variation, or segmental duplication have previously been reported on chromosome 2q33.1. Repeat elements are depicted as grey boxes. Using several combinations of primer pairs, genomic sequencing of carrier chromosomes allowed us to cover over 7 Kb and showed a partial deletion sequence at the 5′ region of MARS2 and an insertion in the 3′ region. Sequencing and CGH-array data suggest that homologies among repeat elements are responsible for complex rearrangements accompanying the MARS2 duplications. (B) Illustration of the putative order and origin of the complex rearrangements found in the MARS2 gene in ARSAL patients. The gene begins on the left (5′). The ORF is colored red and the UTRs blue. As mentioned above, the events share a common junctional sequence position, near the stop codon (black box). The presence of repetitive elements within MARS2 3′UTR and at the 5′ end is suggestive of a template-driven event (event (1) slippage or replication fork pause) that caused partial deletions or insertion (ABC8_43216400 E17, Yoruba sample) at the DNA lesion site (event (2A), (2B), or (2C)). We hypothesize that the complex genomic architecture that has similar sequence features may be able to form cruciform structures, suggesting that these events may be recurrent and stimulated by the abundance of AT-rich sequences around and within the MARS2 gene (event (3)). The replication fork may have switched to another nearby homologous template consisting of short direct or inverted repeats (event (4)) resulting in the generation of duplication events, which could be advancing in either direction. Sequencing and CGH-array data suggest that homologies among repeat elements are responsible for the yielding of complex rearrangements accompanying the MARS2 duplications, but we could not determine the orientation. (C) Illustration of the four predicted rearrangements of the MARS2 region seen in ARSAL patients. The most common rearrangement is Duplication 1, in which two copies of MARS2 are detected on each chromosome. The first one contains the entire coding and noncoding sequence, however the duplicated copy includes only the coding sequence. The brackets (//) refer to the fact that the duplication occurs at a distance from the endogenous MARS2 gene, at least 15 Kb away, based upon our quantitative Southern data. Duplication 2 is very similar to the first one with the exception that the rearrangement includes a small deletion in the 3′UTR (caused by event 2A). The genomic structure of the third mutation (Duplication-Deletion) displays a large deletion of the MARS2 coding region (referred by the event 2B) resulting in a truncated MARS2 protein. Quantitative experiments on both genomic and mRNA reveal a deletion rearrangement with partial duplication of the coding region of MARS2. A 726 bp discordant clone (ABC8_43216400 E17, Yoruba sample) containing a 276 bp LINE sequence (L2) within the coding sequence of the MARS2 gene is reported in the UCSC track from the Human Genome Structural Variation Project data, though its impact on mRNA and protein is unknown.
Figure 8
Figure 8. MARS2 mRNA expression, protein levels, mitochondrial protein translation, Complex I, aconitase activity, and cell proliferation.
(A) Quantification of MARS2 mRNA expression levels was performed on six ARSAL cases and two control lymphoblast cell lines. Relative expression levels were normalized to GAPDH levels. ARSAL patients expressed up to 3× higher MARS2 mRNA levels compared to controls. (B) Mitochondrial protein synthesis was measured in lymphoblasts and fibroblasts from three controls and six ARSAL patients by pulse-labeling mitochondrial translation products with 35S-methionine for 1 h in the presence of emetine, followed by electrophoresis on a 15%–20% linear-gradient polyacrylamide gel. The 13 mitochondrial products are identified at the left of the figure. A generalized mitochondrial translation deficiency is observed in three of the six ARSAL patients tested. ANOVA analysis revealed significance for three of the patient's mitochondrial translation levels: Ctrl 1-B4: **, Ctrl 1-B5: n.s., Ctrl 1-P24: n.s., Ctrl 2-B4: ***, Ctrl 2-B5: n.s., Ctrl 2-P24: *, Ctrl 3-B4: ***, Ctrl 3-B5: *, Ctrl 3-P24: ***. (C) Immunoblotting analysis was performed with antibodies against the proteins indicated at the left of the panel. MARS2 was visualized using a polyclonal antibody. For case E10 carrying the heterozygous deletion (c.681Δ268bpfx236X), the truncated product is detected at the estimated size of 24 kDa (arrow); ARSAL patients (B4, EE41, P24, B5, AA35, and E10) show decreased levels of MARS2 protein at the estimated normal size of MARS2 (67 kDa). The 130 kDa LRPPRC and the 12 kDa SLIRP were used as loading controls. (D) Each patient's MARS2 protein-level intensity from the Western Blot shown in (C) was quantified using ImageJ and divided by the protein-level intensities of LRRPRC and SLIRP. The results were then graphed for the controls and the patients, respectively. (E) Respiratory chain activity for Complex I was measured from patient fibroblast-derived disrupted mitochondria. Mutant mitochondria exhibit deficiency of complex I. Data are expressed as percentage control activity (mean ± s.e.m.). (F) Quantification of native and reactivated aconitase activity for ARSAL patient and control immortalized fibroblasts. Three controls and 6 ARSAL patients were used for the analysis. (G) Quantification of the proliferation rate for the same above-mentioned fibroblasts. (H) Graph showing the average age of onset for the three different genotypes involved.

Similar articles

Cited by

References

    1. Schapira A. H. Mitochondrial disease. Lancet. 2006;368:70–82. - PubMed
    1. Wallace D. C. Mitochondrial DNA mutations in disease and aging. Environmental and Molecular Mutagenesis. 2010;51:440–450. - PubMed
    1. Mollet J, Delahodde A, Serre V, Chretien D, Schlemmer D, et al. CABC1 gene mutations cause ubiquinone deficiency with cerebellar ataxia and seizures. Am J Hum Genet. 2008;82:623–630. - PMC - PubMed
    1. Berger I, Hershkovitz E, Shaag A, Edvardson S, Saada A, et al. Mitochondrial complex I deficiency caused by a deleterious NDUFA11 mutation. Ann Neurol. 2008;63:405–408. - PubMed
    1. Hudson G, Amati-Bonneau P, Blakely E. L, Stewart J. D, He L, et al. Mutation of OPA1 causes dominant optic atrophy with external ophthalmoplegia, ataxia, deafness and multiple mitochondrial DNA deletions: a novel disorder of mtDNA maintenance. Brain. 2008;131:329–337. - PubMed

Publication types

MeSH terms