Comparative Study
. 2012;7(3):e33633.
doi: 10.1371/journal.pone.0033633. Epub 2012 Mar 20.

Semaphorin 3A suppresses tumor growth and metastasis in mice melanoma model

Affiliations
Comparative Study

Semaphorin 3A suppresses tumor growth and metastasis in mice melanoma model

Goutam Chakraborty et al. PLoS One. 2012.

Abstract

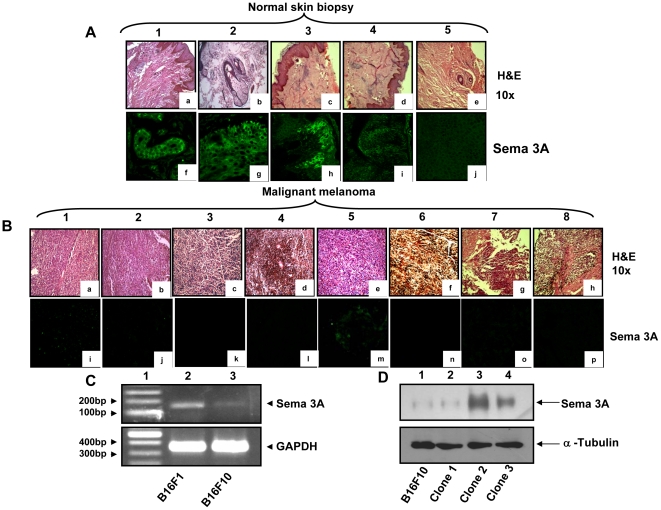
Background: Recent understanding on cancer therapy indicated that targeting metastatic signature or angiogenic switch could be a promising and rational approach to combat cancer. Advancement in cancer research has demonstrated the potential role of various tumor suppressor proteins in inhibition of cancer progression. Current studies have shown that axonal sprouting inhibitor, semaphorin 3A (Sema 3A) acts as a potent suppressor of tumor angiogenesis in various cancer models. However, the function of Sema 3A in regulation of melanoma progression is not well studied, and yet to be the subject of intense investigation.

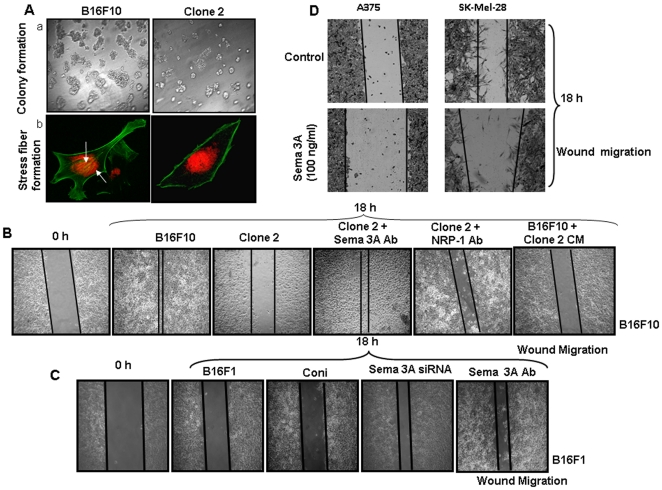
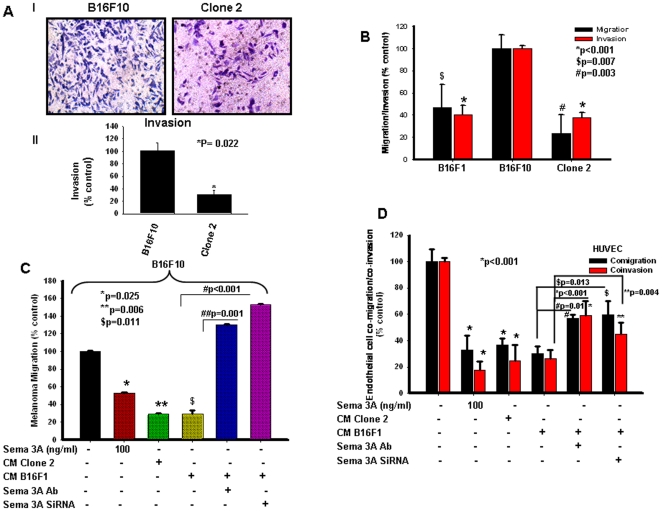
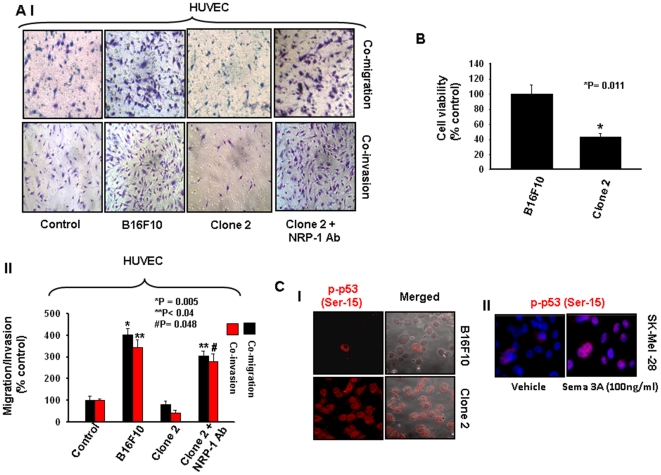
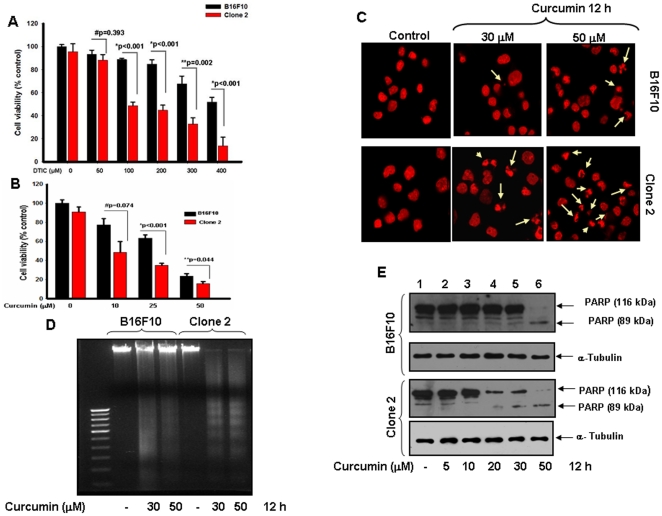
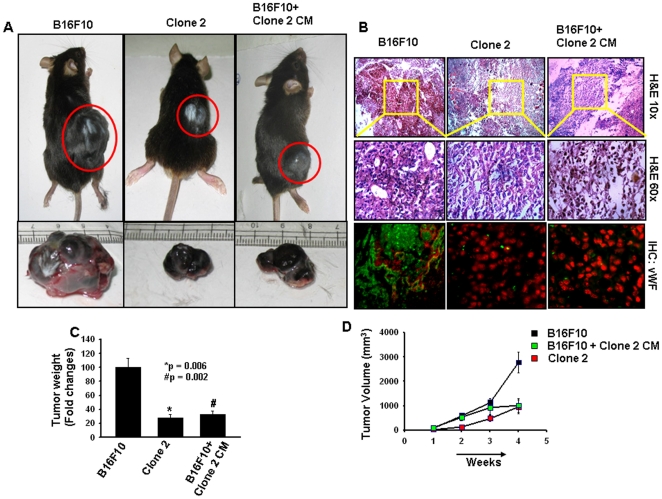
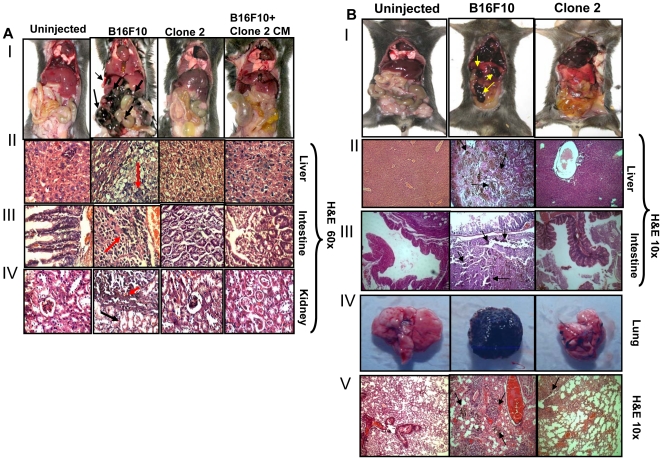
Methodology/principal findings: In this study, using multiple in vitro and in vivo approaches we have demonstrated that Sema 3A acts as a potent tumor suppressor in vitro and in vivo mice (C57BL/6) models. Mouse melanoma (B16F10) cells overexpressed with Sema 3A resulted in significant inhibition of cell motility, invasiveness and proliferation as well as suppression of in vivo tumor growth, angiogenesis and metastasis in mice models. Moreover, we have observed that Sema 3A overexpressed melanoma clone showed increased sensitivity towards curcumin and Dacarbazine, anti-cancer agents.

Conclusions: Our results demonstrate, at least in part, the functional approach underlying Sema 3A mediated inhibition of tumorigenesis and angiogenesis and a clear understanding of such a process may facilitate the development of novel therapeutic strategy for the treatment of cancer.


Conflict of interest statement

Competing Interests: The authors have declared that no competing interests exist.

Figures

Figure 1
Figure 1. Histopathological and immunohistochemical analyses of human normal skin biopsy and malignant melanoma tissues.
(A&B) Five normal skin biopsy and eight malignant melanoma specimens were stained with hematoxylin and eosine and the histopathologic micrographs were visualized at 10× magnifications (Fig. 1A, panels a–e, & Fig. 1B, panels a–h). Tissue sections were also analyzed immunohistochemially for visualizing the expression of Sema 3A (Fig. 1A, panels f–j & Fig. 1B, panels i–p). Sema 3A was stained with Cy2 (Green). Note that significant loss of Sema 3A expression was detected in malignant melanoma tissue samples as compared to normal skin samples. (C) Endogenous expression of Sema 3A mRNA in B16F1 and B16F10 cells as detected by RT-PCR. GAPDH was used as loading control. (D) Expression of Sema 3A in B16F10 clones were analyzed by Western blot using specific antibody. The second clone (lane 3, denoted as clone 2) shows significantly higher expression of Sema 3A as compared to other clones and control B16F10 cells. The data represent three independent experiments exhibiting similar results.
Figure 2
Figure 2. Loss-and-gain of Sema 3A functions and it's correlation with metastatic phenotype of melanoma cells.
(A) panel a, equal number of control B16F10 and clone 2 cells (1×10⁴) were grown on matrigel coated plate and incubated at 37°C for 7 days. Colony photographs were taken at 10× magnification. Panel b, control B16F10 and clone 2 cells (1×10⁴) were plated on fibronectin coated coverslips and incubated for 6 h. Cells were fixed in 2% PFA and stained with FITC-conjugated phalloidin (green). Stress fibers were shown by arrows. Nuclei were stained with PI (red). Photographs were taken at 60× magnification. (B) The effect of Sema 3A on B16F10 cell motility was performed by wound migration assay. Control B16F10 or clone 2 positive cells were used for wound migration. In separate experiments, clone 2 positive cells either treated with anti-Sema 3A or anti-NPR1 blocking antibody were used for wound migration assay. In another experiments, control B16F10 cells were incubated with conditioned medium (CM) collected from clone 2 and wound migration assay was performed. After 18 h, cells were visualized and photographed under Nikon microscope at 10× magnification. (C) To further study the loss-of-function of Sema 3A in regulating melanoma cell migration, wound assay was performed using B16F1 cells. Cells were either transfected with Sema 3A siRNA or treated with Sema 3A blocking antibody and used for migration assay. (D) To study the gain-of-function, wound migration assays were performed using A375 or SK-Mel-28 cells treated with recombinant exogenous Sema 3A for 18 h. Sema 3A significantly attenuates wound motility of melanoma cells. All the data shown here are the representatives of triplicate independent experiments.
Figure 3
Figure 3. Sema 3A inhibits melanoma cell migration and invasion through autocrine and paracrine mechanisms.
(A) Invasion assays were performed on matrigel coated invasion chamber. Cells (control or clone 2; 1×10⁵) were plated on upper chamber. After 18 h, invaded cells were stained with Giemsa and photographed (panel I), counted in 3 high-power fields (C/HPF) under an inverted microscope (Nikon), analyzed statistically and represented in the form of bar graph (panel II, *P = 0.022). (B) Autocrine mechanism of Sema 3A action on melanoma motility and invasiveness were demonstrated by migration and invasion assay using either B16F10 or clone 2 or B16F1 cells. *p<0.001, $p = 0.007, #p = 0.003 vs. B16F10. (C) Boyden chamber migration assay was performed using B16F10 cells to demonstrate the paracrine mechanism of action of Sema 3A. Conditioned media (CM) collected from clone 2 or B16F1 cells alone or B16F1 transfected with Sema 3A siRNA were used in the lower chamber as a chemoattractant. In separate experiments, either B16F10 cells treated with Sema 3A (100 ng/ml) or CM from B16F1 treated with Sema 3A antibody were used in the lower chamber. Migrated cells were counted, analyzed statistically and represented graphically. *p = 0.025, **p = 0.006 and $p = 0.011 vs. control, #p<0.001, ##p = 0.001. (D) Tumor-endothelial interaction was performed in modified Boyden chamber or matrigel coated invasion chamber. Endothelial cells were placed on upper chamber whereas similar conditioned media (as of Fig. 3C) were used in the lower chamber. Migrated or invaded cells were stained with Giemsa, photographed, analyzed statistically and represented in the form of graph. *p<0.001 vs. control, **p = 0.004, #p = 0.01, $p = 0.013.
Figure 4
Figure 4. Sema 3A augments p53 phosphorylation and attenuates tumor-endothelial interaction via neuropilin 1 (NRP1) mediated paracrine mechanism.
(A) Tumor-endothelial interaction was performed in modified Boyden chamber or matrigel coated invasion chamber. Endothelial cells (HUVEC) were placed on upper chamber whereas tumor (control B16F10 or clone 2) cells were used in lower chamber. In separate experiments, HUVEC were treated with anti-NRP1 blocking antibody and used on the upper chamber. After 18 h, migrated or invaded cells were stained with Giemsa, photographed (Fig. 4A, panel 1), counted in three high power field (C/HPF) and represented in the form of bar graph (panel II, *p = 0.005 vs. control, **p<0.04 vs. control, #p = 0.048 vs. control). The experiments were performed in triplicate. (B) Overexpression of Sema 3A inhibits cell viability of B16F10 cells. Equal number of control B16F10 or clone 2 cells (1×10⁴) were grown in 96 well tissue culture plates and cell viability was performed by MTT assay. The data are represented in the form of bar graph (*p = 0.011) and the mean value of triplicate experiments is indicated. (C) Sema 3A augments Ser-15 phosphorylation of p53. The phosphorylation at Ser-15 of p53 was analyzed by immunofluorescence using specific antibody followed by Cy3 (red) labeled secondary antibody. Photographs were taken under confocal microscope at 60× magnification (Fig. 4C, panel I). The typical photographs have shown here represents three independent experiments exhibiting similar results. Similarly, SK-Mel-28 cells were treated with Sema 3A (100 ng/ml) and the level of phospho-p53 at Ser-15 was analyzed by confocal microscopy (Fig. 4C, panel II).
Figure 5
Figure 5. Sema 3A overexpressed clone exhibits increased drug sensitivity in B16F10 cells.
(A) Control or clone 2 cells were treated with melanoma specific drug, Dacarbazine (DTIC) (0–400 µM) for 24 h and cells survival was analyzed by MTT assay. #p = 0.393, *p<0.001, **p = 0.002 vs. respective treatment group within B16F10 and clone 2 cells. (B) Similarly, both cells were treated with curcumin (0–50 µM) for 12 h and cell viability was checked by MTT assay. The data are represented in the form of bar graph and the mean value of triplicate experiments is indicated. #p = 0.074, *p<0.001, **p = 0.044 vs. respective treatment group within B16F10 and clone 2 cells. (C) Both cells were treated with indicated concentrations of curcumin, fixed and stained with PI (red) and photographed under fluorescence microscope at 60× magnifications. The apoptotic nuclei are indicated by arrows. (D) Cells were treated with two doses of curcumin for 12 h. Fragmentation of genomic DNA was extracted and resolved on 2% agarose gel. Apoptotic DNA fragmentation was visualized by ethidium bromide staining. (E) Curcumin induced apoptosis in control and clone 2 cells were also analyzed by Western blot using anti-PARP antibody. Cells were treated with 0–50 µM curcumin for 12 h and then analyzed by Western blot. α-Tubulin was used as loading control. The experiments showed here are representative of triplicate independent experiments with similar results.
Figure 6
Figure 6. Overexpression of Sema 3A abrogates in vivo melanoma growth and angiogenesis in subcutaneous allograft tumor model in C57BL/6 mice.
Control B16F10 and clone 2 cells (1×10⁶/mice) were injected subcutaneously into the dorsal flank region of male mice (6–8 weeks old; n = 6). In separate experiments, serum free conditioned media (CM) collected from clone 2 cells were injected intratumorally twice a week to the tumors generated by B16F10 cells upto termination of the experiments (n = 6). Mice were sacrificed after 4 weeks. (A) Typical photographs of subcutaneous melanoma in C57BL/6 mice and excised tumors of respective mice were shown. (B) Mice allograft tumors were analyzed by histopathology and immunohistochemistry using anti-vWF antibody. vWF was stained with Cy2 (green) whereas nuclei were countered stained with PI (red). (C) Weight of the excised tumors were measured, analyzed and represented in the form of bar graph (*p = 0.006, #p = 0.002). (D) Tumor volumes of the allograft melanoma tumors were measured weekly, analyzed and plotted graphically. Six mice were used in each set of experiments.
Figure 7
Figure 7. Sema 3A overexpression attenuates melanoma metastasis.
(A) The mice described in Fig. 6A, were dissected ventrally and photographed. Growth of melanoma tumors were indicated by arrows (Fig. 7A, panel I). Internal organs (liver, intestine and kidney) were analyzed histopathologically and the micrographs were shown at 60× magnification (Fig. 7A, panels II–IV). Melanoma positive cells in metastatic lesions were marked by red arrows, whereas surrounding stromal regions were indicated by black arrows. Six mice were used in each group. Un-injected mice are used as control. (B) Sema 3A attenuates melanoma metastasis in mice. Control or clone 2 cells were injected intracardiaclly and mice were sacrificed, dissected ventrally and photographed (Fig. 7B, panel I). Metastasized organs were indicated by arrows. Liver and intestine of the mice were analyzed histopathologically by H&E staining (Fig. 7B, panels II & III). Micrographs were taken at 10× magnification. Arrows showed the melanoma foci. Fig. 7B, panel IV shows the excised lung of respective mice. Lung sections were also analyzed histopathologically and photographs were taken at 10× magnification (Fig. 7B, panel V). Melanoma metastatic foci in lung sections are indicated by arrows. Six mice were used in each set of experiment. Un-injected mice were used as control.

Similar articles

Cited by

References

    1. Jemal A, Siegel R, Xu J, Ward E. Cancer Statistics, 2010. CA Cancer J Clin. 2010;60:277–300. - PubMed
    1. Tamagnone L, Comoglio PM. To move or not to move? Semaphorin signalling in cell migration. EMBO Rep. 2004;5:356–361. - PMC - PubMed
    1. Kolodkin AL, Matthes DJ, Goodman CS. The semaphorin genes encode a family of transmembrane and secreted growth cone guidance molecules. Cell. 1993;75:1389–1399. - PubMed
    1. Tamagnone L, Comoglio PM. Signalling by semaphorin receptors: cell guidance and beyond. Trends Cell Biol. 2000;10:377–383. - PubMed
    1. Bielenberg DR, Klagsbrun M. Targeting endothelial and tumor cells with semaphorins. Cancer Metastasis Rev. 2007;26:421–431. - PubMed

Publication types

MeSH terms