. 2012 May;180(5):2040-55.
doi: 10.1016/j.ajpath.2012.01.035. Epub 2012 Mar 23.

A mouse model of Schwartz-Jampel syndrome reveals myelinating Schwann cell dysfunction with persistent axonal depolarization in vitro and distal peripheral nerve hyperexcitability when perlecan is lacking

Affiliations

A mouse model of Schwartz-Jampel syndrome reveals myelinating Schwann cell dysfunction with persistent axonal depolarization in vitro and distal peripheral nerve hyperexcitability when perlecan is lacking

Marie Bangratz et al. Am J Pathol. 2012 May.

Abstract

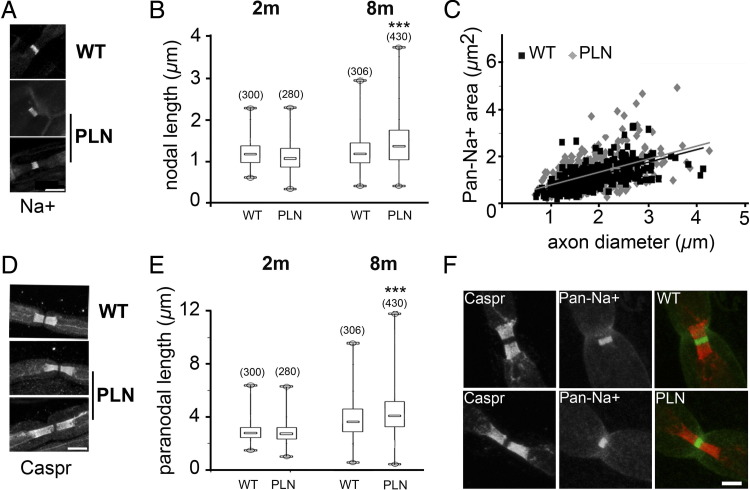
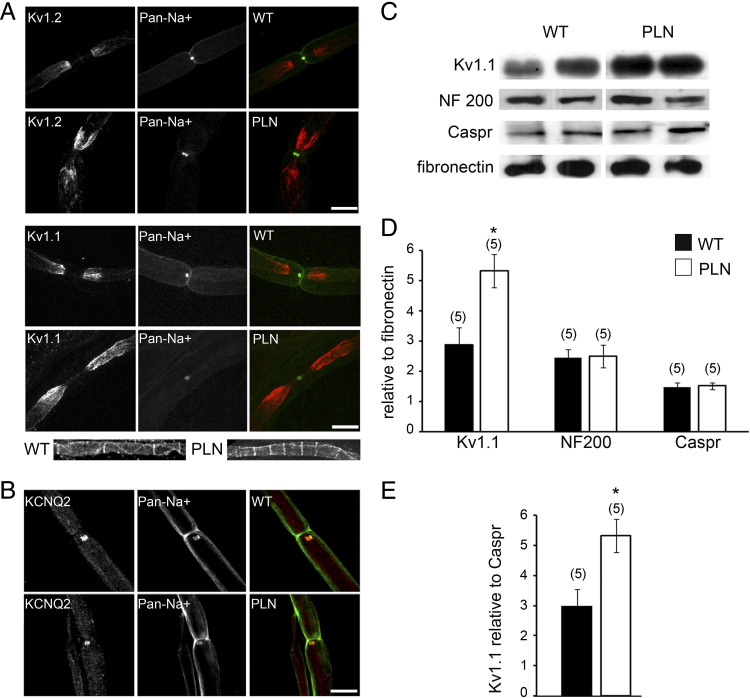
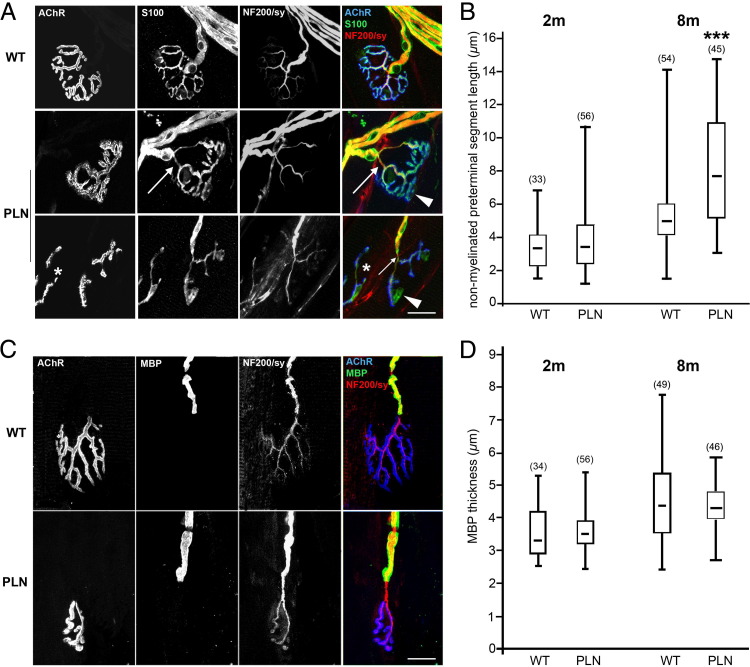
Congenital peripheral nerve hyperexcitability (PNH) is usually associated with impaired function of voltage-gated K(+) channels (VGKCs) in neuromyotonia and demyelination in peripheral neuropathies. Schwartz-Jampel syndrome (SJS) is a form of PNH that is due to hypomorphic mutations of perlecan, the major proteoglycan of basement membranes. Schwann cell basement membrane and its cell receptors are critical for the myelination and organization of the nodes of Ranvier. We therefore studied a mouse model of SJS to determine whether a role for perlecan in these functions could account for PNH when perlecan is lacking. We revealed a role for perlecan in the longitudinal elongation and organization of myelinating Schwann cells because perlecan-deficient mice had shorter internodes, more numerous Schmidt-Lanterman incisures, and increased amounts of internodal fast VGKCs. Perlecan-deficient mice did not display demyelination events along the nerve trunk but developed dysmyelination of the preterminal segment associated with denervation processes at the neuromuscular junction. Investigating the excitability properties of the peripheral nerve suggested a persistent axonal depolarization during nerve firing in vitro, most likely due to defective K(+) homeostasis, and excluded the nerve trunk as the original site for PNH. Altogether, our data shed light on perlecan function by revealing critical roles in Schwann cell physiology and suggest that PNH in SJS originates distally from synergistic actions of peripheral nerve and neuromuscular junction changes.


Figures

Figure 1
Figure 1
Reduced amount of perlecan in Schwann cell BMs of PLN mutant mice. A: Schematic representation of the mutated Hspg2C1532Yneo allele and analysis of the splicing events occurring among exons 35, 36, and 37 of the perlecan gene in sciatic nerve samples of 8-month-old PLN and WT mice. The c.4595G>A substitution encoding the p.C1532Y missense mutation is located in exon 36, and PGK-neo is located in intron 36. Agarose gel resolution of RT-PCR products showed normally spliced perlecan mRNAs containing the c.4595G>A mutation in PLN samples using primers binding within exons 35 and 37 (right). Hybrid mRNAs, resulting from splicing between exon 35 and PGK-neo, were also observed in PLN mutant samples using primers binding within exon 35 and PGK-neo (left). B: Representative perlecan immunostaining (green) of sciatic nerve sections (top; DAPI in blue), teased sciatic nerve fibers (middle; Caspr in red), and longitudinal TA sections (bottom; AChR in red) from 8-month-old mice. Perlecan is present in perineural and Schwann cell BM in WT mice. Perlecan is more abundant in the BM around the nodes of Ranvier as demonstrated by immunostaining of teased WT sciatic nerve fibers with paranodes stained with an antibody directed against Caspr (middle) and in the synaptic BM as shown by fluorescent staining of postsynaptic AChR with BTX (bottom). A reduced amount of perlecan was observed in all BM of PLN mice with a punctuate staining that results from the intracellular retention of the mutated p.C1532Y perlecan. Scale bars: 50 μm (top), 40 μm (middle), and 20 μm (bottom). C: Quantitative analysis of perlecan immunostaining demonstrates that the amount of perlecan in the BM around the nodes of Ranvier and along internodes was reduced by 70% in PLN mice (white bars) compared with the amount observed in WT mice (black bar) (***P < 0.001, two-way analysis of variance). Results are expressed as mean ± SEM percentage of perlecan immunostaining along internodes or around nodes with the mean percentage of WT immunostaining set to 100. Numbers of values are indicated in parentheses on the graph (with n = 64 nodes and n = 124 internodes for WT mice).
Figure 2
Figure 2
Polyaxonal myelination and decrease of myelin thickness in PLN mice. A: No major differences were observed between transverse semithin sections (toluidine blue staining) of sciatic nerves from 8-month-old PLN mice and WT mice. Scale bar = 50 μm. B: Transverse EM analyses of sciatic nerves did not detect major defects in PLN mice compared with WT mice except for the increased amount of polyaxonal myelination events. Scale bar = 2 μm. C: Distribution of percentage of fibers in relation to the axon diameter showed a small but significant shift toward higher values in PLN mice compared with WT mice (P < 0.001, χ2 test; n = 8423 and n = 6860 for WT and PLN mice, respectively). D: Distribution of the g ratio in relation to the axon diameter showed a marginal but significant increase in all categories between PLN mice and WT mice (*P < 0.05, **P < 0.01; ***P < 0.001, Student's t-test for each axonal category).
Figure 3
Figure 3
Increased length of nodal and paranodal regions in 8-month-old PLN mice. Immunostaining of nodal (A) and paranodal (D) regions in the nodes of Ranvier with Pan-Na+ and Caspr markers, respectively, shows apparently normal (middle) and longer (bottom) nodes and paranodes in PLN mice versus WT mice. Box plot representations of nodal (B) and paranodal (E) lengths showed the presence of longer nodes in 8-month-old (8m) but not in 2-month-old (2m) PLN mice versus WT mice (***P < 0.001, Mann-Whitney U-test). Box plot graphs depict minimal value, lower quartile, median, upper quartile, and maximal value from bottom to top with the number of values indicated in parentheses. C: The representation of the area filled by Na+ channels in relation to the axon diameter did not show a difference between 8-month-old PLN and WT mice. F: A representative co-immunostaining of teased nerve fibers showed a normal organization without any overlap of nodal (anti-Pan Na+ channel in green) and paranodal (anti-Caspr in red) regions at the nodes of Ranvier in 8-month-old PLN mice (bottom). Scale bar = 5 μm.
Figure 4
Figure 4
Overexpression of juxtaparanodal VGKCs in PLN mice. A: Representative immunostaining of Kv1.1 and Kv1.2 (red) with Na+ channels (green) showing more intense juxtaparanodal Kv1.1 and Kv1.2 stainings in 8-month-old PLN mice versus WT mice. Kv1.1 staining was also observed in the juxtamesaxon, a circumferential strip extending along the internode, and in the juxtaincisures, which appeared to be more numerous in PLN than in WT mice (bottom). B: KCNQ2 immunostaining (red) was present at the nodes of PLN mice, stained with anti-Pan Na+ channels (green) and did not differ from that observed in WT mice. Scale bar = 15 μm. C: Representative immunoblot analyses of Kv1.1, NF200, Caspr, and fibronectin expression in sciatic nerves from 8-month-old WT and PLN mutant mice, suggesting a higher amount of Kv1.1 in mutant samples than in WT samples. Quantification of immunoblot analyses using fibronectin (D) or Caspr (E) signal for normalization shows that the amount of Kv1.1 was significantly increased in PLN samples compared with WT samples. Results are reported as means ± SEM (*P < 0.05; Mann-Whitney U-test with number of studied samples indicated in parentheses).
Figure 5
Figure 5
Higher number of SLIs and shorter length of internodes in PLN mice. A: Representative immunostaining of SLIs with NrCAM and connexin 29 (Cx29) proteins showing the increased number of SLIs along the teased sciatic nerve fibers of PLN mice versus WT mice. Scale bar = 30 μm. Box plot representations of distances between adjacent SLIs (B) and ILs (C) showed the decreased values in 2- (2m) and 8- month-old (8m) PLN mice compared with age-matched WT mice (***P < 0.001, Mann-Whitney U-test). Box plot graphs depict minimal value, lower quartile, median, upper quartile, and maximal value from bottom to top with numbers of values indicated in parentheses. D: Visualization of internodes immunostained with pan-neurofascin (pan-NF in green) and Schwann cell nuclei (DAPI in blue) in teased sciatic nerves showed shorter internodes concomitant to an increased number of myelinating Schwann cells in 8-month-old PLN mice compared with WT mice. SLIs, nodes, and Schwann cell nuclei are labeled with asterisks, arrowheads, and n, respectively. Scale bar = 40 μm. E: Calculation of abaxonal appositions per Schwann cell in WT and PLN mice did not show any significant difference in distributions between the two genotypes (n = 121 for PLN mice and n = 135 for WT mice).
Figure 6
Figure 6
Denervation-reinnervation processes at the NMJ with dysmyelination of the preterminal segment in PLN mice. A: Representative fluorescent staining of postsynaptic AChRs (BTX in blue), Schwann cells (anti-S100 in green), and motor nerve terminals [anti-NF200 and anti-synaptophysin (sy) in red] in longitudinal sections of TA from 8-month-old mice. NMJs of WT mice displayed AChRs with a pretzel-like organization that is recovered by nerve terminal and tSCs. S100 staining of the preterminal nerve segment is thick with well-defined positions of Schwann cell nuclei, which are suggestive of myelination (top). In PLN mice, AChRs displayed a streaky pattern with poor or no pretzel-like organization. Denervation processes were seen in mutant NMJs with areas of AChRs devoid of nerve terminal (arrowhead) and thin preterminal S100 staining (arrow). NMJs with highly fragmented AChRs were also seen in 8-month-old PLN mice (asterisk). Scale bar = 20 μm. B: Box plot representations of nonmyelinated preterminal segment lengths showed increased values in PLN mutant mice compared with WT mice. The difference was statistically significant at the age of 8 months (***P < 0.001, Mann-Whitney U-test). C: A representative fluorescent staining of AChRs (BTX in blue), myelin sheath (anti-MBP in green), motor axon, and nerve terminal (anti-NF200 and anti-synaptophysin in red) showed a longer nonmyelinated preterminal segment in a well-innervated NMJ of an 8-month-old PLN mouse compared with a WT mouse. Scale bar = 20 μm. D: Box plot representations of the thickness of preterminal MBP staining showed the absence of high values in 8-month-old PLN mice compared with WT mice. The absence of high values in PLN mice was less pronounced at the age of 2 months. All box plot graphs depict minimal value, lower quartile, median, upper quartile, and maximal value from bottom to top with number of values indicated in parentheses.
Figure 7
Figure 7
Increased threshold undershoot in 8-month-old PLN mutant mice. A: Threshold changes (threshold reduction or increased excitability plotted upwards) induced by a 100-ms subthreshold depolarizing current determined in vivo from the plantar muscle of 8-month-old WT (filled symbols) and PLN (open symbols) mice. B: Threshold undershoot was characterized by a 1–6 fold threshold increase after the end of the 100 ms current in PLN mice compared with WT mice. Data are expressed as means ± SEMs with number of values in parentheses (**P < 0.01; Student's t-test).
Figure 8
Figure 8
In vitro effects of depolarization induced by raising extracellular K+ on sciatic nerve activity of 8-month-old PLN mice. A: CNAP amplitude obtained in response to repetitive stimulations (100 ms, 100 to 1000 Hz) at 35°C represented as a function of the stimulation frequency at physiologic (3 mmol/L) extracellular K+ concentration. The amplitude of the last CNAP is expressed as a percentage of the amplitude of the CNAP before repetitive stimulation. The CNAPs from PLN mice were increasingly attenuated at high-frequency stimulation (700 to 1000 Hz) compared with WT mice (filled squares) B: Amplitude of CNAPs from PLN and WT mice was measured at increasing extracellular K+ concentrations. The attenuation of CNAP amplitude obtained in response to a single stimulus was higher in PLN nerves (white bars) than in WT nerves (black bars) when extracellular K+ was raised to 12 and 15 mmol/L. C: CNAP amplitude obtained in response to increasing train frequency (100 ms, 100 to 500 Hz) represented as a function of the stimulation frequency obtained at high (12 mmol/L) extracellular K+ concentration. A higher degree of CNAP attenuation was seen at all frequencies of stimulation in PLN nerves compared with WT nerves when extracellular KCl was increased to 12 mmol/L. The graphs depict means ± SEMs (*P < 0.05 and **P < 0.01; Student's t-test with n > 10 from at least eight independent mice).

References

    1. Hart I., Newsom-Davis J. Generalized peripheral nerve hyperexcitability (neuromyotonia) In: Engel A., Franzini-Armstrong C., editors. McGraw-Hill Medical Publishing Division; New York: 2004. pp. 1301–1309.
    1. Waxman S.G., Ritchie J.M. Molecular dissection of the myelinated axon. Ann Neurol. 1993;33:121–136. - PubMed
    1. Browne D.L., Gancher S.T., Nutt J.G., Brunt E.R., Smith E.A., Kramer P., Litt M. Episodic ataxia/myokymia syndrome is associated with point mutations in the human potassium channel gene, KCNA1. Nat Genet. 1994;8:136–140. - PubMed
    1. Jen J.C., Graves T.D., Hess E.J., Hanna M.G., Griggs R.C., Baloh R.W. Primary episodic ataxias: diagnosis, pathogenesis and treatment. Brain. 2007;130:2484–2493. - PubMed
    1. Dedek K., Kunath B., Kananura C., Reuner U., Jentsch T.J., Steinlein O.K. Myokymia and neonatal epilepsy caused by a mutation in the voltage sensor of the KCNQ2 K+ channel. Proc Natl Acad Sci U S A. 2001;98:12272–12277. - PMC - PubMed

Publication types

MeSH terms