

Review
doi: 10.1085/jgp.201210773.
Intracellular calcium movements during excitation-contraction coupling in mammalian slow-twitch and fast-twitch muscle fibers
Affiliations
- PMID: 22450485
- PMCID: PMC3315149
- DOI: 10.1085/jgp.201210773
Item in Clipboard
Review
Intracellular calcium movements during excitation-contraction coupling in mammalian slow-twitch and fast-twitch muscle fibers
J Gen Physiol.
2012 Apr.
Abstract
In skeletal muscle fibers, action potentials elicit contractions by releasing calcium ions (Ca(2+)) from the sarcoplasmic reticulum. Experiments on individual mouse muscle fibers micro-injected with a rapidly responding fluorescent Ca(2+) indicator dye reveal that the amount of Ca(2+) released is three- to fourfold larger in fast-twitch fibers than in slow-twitch fibers, and the proportion of the released Ca(2+) that binds to troponin to activate contraction is substantially smaller.
Figures
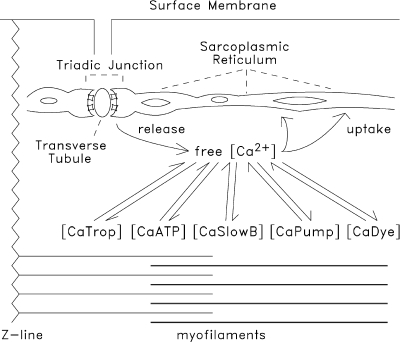
Schematic of intra-sarcomeric Ca2+ movements during excitation–contraction coupling in mammalian skeletal muscle fibers. Depolarization of the transverse tubular membranes initiates Ca2+ release from the SR at the triadic junctions. The rise in myoplasmic free [Ca2+] drives Ca2+ complexation with the major myoplasmic Ca2+ buffers: (a) troponin (located on the thin filaments); (b) ATP; (c) other proteins (“SlowB”) such as parvalbumin, which, in rodent fibers, is found at a large concentration in fast-twitch glycolytic fibers but not in slow-twitch fibers (Table 2); (d) Ca2+ pump molecules (located in the SR membranes); and (e) the Ca2+ indicator dye (which can be introduced experimentally to monitor Δ[Ca2+]).
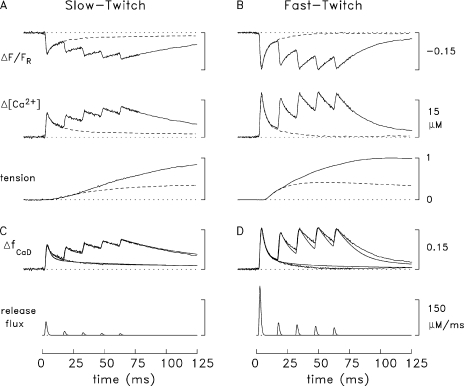
Ca2+-related fluorescence signals and tension responses in slow-twitch and fast-twitch mouse fibers stimulated by APs (16°C). (A and B) Bundles of fibers from soleus muscles (A) and EDL muscles (B) of adult mice, age 7–14 wk, were isolated by dissection, and one fiber within the bundle was micro-injected with either furaptra or mag-fluo-4. ΔF/FR and tension responses were recorded in response to external stimuli that elicited either one AP (dashed traces) or five APs at 67 Hz (continuous traces); the responses to both types of stimulation are shown superimposed. All traces represent averaged responses from several experiments in which movement artifacts in the ΔF/FR traces were small. All fast-twitch experiments were performed on fibers injected with furaptra (seven fibers in the measurements with a single AP, four in the measurements with five APs); the fast-twitch fibers are from a region of the EDL muscle thought to be rich in parvalbumin (see Baylor and Hollingworth, 2011). The slow-twitch experiments with a single AP are from 11 experiments (five with furaptra and six with mag-fluo-4); those with five APs are from three experiments (one with furaptra and two with mag-fluo-4). Before inclusion in the average responses, the mag-fluo-4 traces were scaled so that their amplitude matched that expected with furaptra (Hollingworth et al., 2009, 2012). ΔF/FR, in furaptra fluorescence units, was converted to ΔfCaD and Δ[Ca2+] as described in the text. For both fiber types, a value of 1 on the tension calibration bar corresponds to the peak tension response with the five-AP stimulus. With one AP, the time of peak and FDHM of the slow-twitch tension response are 192 and 1,001 ms, respectively; the corresponding values for the fast-twitch tension response are 55 and 215 ms; with the five-AP stimulus, the values are 229 and 993 ms for the slow-twitch response and 107 and 236 ms for the fast-twitch response. (C and D) The top traces show simulated furaptra ΔfCaD waveforms (noise-free traces) and measured ΔfCaD waveforms (traces with noise). The simulated traces were obtained with the multi-compartment model described in Fig. 3 and the text. In the model, the reaction scheme between Ca2+ and furaptra includes two pools of furaptra, protein-free and protein-bound (Baylor and Hollingworth, 2007); the protein-bound pool corresponds to the indicator molecules that appear to be bound to myoplasmic constituents of low mobility (Konishi et al., 1991). The bottom traces show the SR Ca2+ fluxes used to drive the simulations. Even though the measurements were made with the fibers stretched to a long sarcomere length (mean value, 3.7 µm), the experimental ΔfCaD traces may still be slightly contaminated with a small movement artifact.
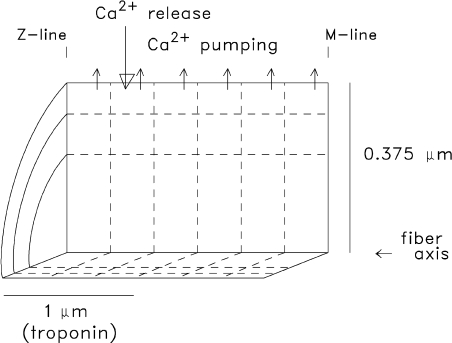
Geometry of the multi-compartment reaction–diffusion model used to simulate myoplasmic Ca2+ movements. The myoplasm of a half-sarcomere of one myofibril is divided into 18 equal-volume radially symmetric compartments (six longitudinal by three radial) at a half-sarcomere length of 2 µm. Ca2+ release (large downward arrow) occurs into the compartment located at the periphery of the myofibril about ∼0.5 µm from the z-line, the location of the triadic junctions in mammalian fibers (Smith, 1966; Eisenberg, 1983; Brown et al., 1998; Gómez et al., 2006). Ca2+ pumping (small upward arrows) is restricted to the six outermost compartments at the periphery of the myofibril (the location of the SR membrane), troponin is restricted to the nine compartments located within 1 µm of the z-line (the location of the thin filaments), and free Ca2+ and the soluble Ca2+ buffers (e.g., ATP, parvalbumin, and the Ca2+ indicator) have access to all compartments via diffusion. The buffer concentrations and reaction rate constants vary with the fiber type and compartment location (see text and Table 2). A set of first-order differential equations is specified for each compartment to describe the Ca2+ concentration changes that take place in that compartment caused by release, binding, pumping, and/or diffusion across compartment boundaries. The full set of equations can be integrated simultaneously once the SR Ca2+ release flux is specified.
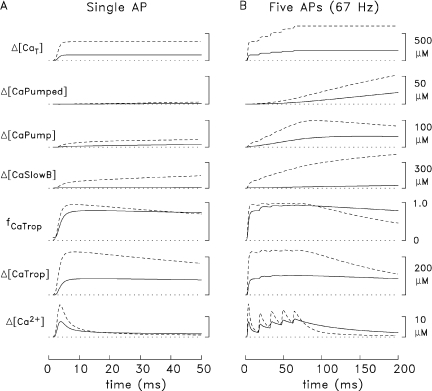
Comparison of Ca2+ movements elicited by APs in slow-twitch and fast-twitch fibers (16°C). (A). Simulated Ca2+ movements in slow-twitch and fast-twitch fibers (continuous and dashed traces, respectively) in response to a single AP initiated at zero time. fCaTrop, the fractional occupancy of the troponin regulatory sites with Ca2+, includes the resting occupancy (0.071 in slow-twitch fibers and 0.004 in fast-twitch fibers) plus the change in occupancy during activity. See text for definitions of the other traces. Δ[CaT] is the sum of the five lower traces, excluding fCaTrop, plus Δ[CaATP] and Δ[CaDye] (the change in the concentration of Ca2+ bound to the indicator). Δ[CaATP] is approximately equal to 2.2 times Δ[Ca2+] in slow-twitch fibers and 3.4 times Δ[Ca2+] in fast-twitch fibers. Δ[CaDye] is relatively small (= ΔfCaD × [DyeT], where [DyeT], the total indicator concentration in myoplasm, is 100 µM). The units of all traces except fCaTrop are spatially averaged concentrations referred to the myoplasmic water volume. (B). As in A, but for five APs at 67 Hz.
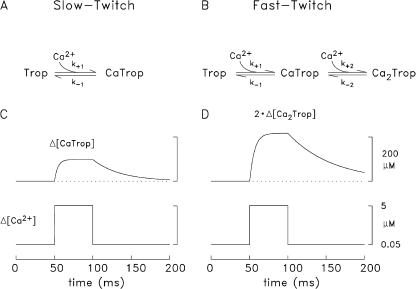
Comparison of the modeled Ca2+–troponin reactions in slow-twitch and fast-twitch fibers. (A and B) Schemes for the reaction of Ca2+ with the regulatory sites on slow-twitch troponin (A) and fast-twitch troponin (B). The text gives the values of the reaction rate constants. (C and D) Theoretical single-compartment responses of the slow-twitch (C) and fast-twitch (D) troponin regulatory sites at 16°C to a pulse of [Ca2+] that starts at 50 nM, rises to 5 µM for 50 ms, and returns to 50 nM; the response in D considers only the doubly occupied troponin state in B. The total site concentrations are 120 µM (C) and 240 µM (D).
References
-
- Allen D.L., Harrison B.C., Sartorius C., Byrnes W.C., Leinwand L.A. 2001. Mutation of the IIB myosin heavy chain gene results in muscle fiber loss and compensatory hypertrophy. Am. J. Physiol. Cell Physiol. 280:C637–C645 - PubMed
Publication types
MeSH terms
Substances
Grants and funding
LinkOut - more resources
Full Text Sources
Miscellaneous
