. 2012 May 5;367(1593):1256-64.
doi: 10.1098/rstb.2011.0377.

Stratospheric ozone depletion due to nitrous oxide: influences of other gases

Affiliations

Stratospheric ozone depletion due to nitrous oxide: influences of other gases

R W Portmann et al. Philos Trans R Soc Lond B Biol Sci. .

Abstract

The effects of anthropogenic emissions of nitrous oxide (N(2)O), carbon dioxide (CO(2)), methane (CH(4)) and the halocarbons on stratospheric ozone (O(3)) over the twentieth and twenty-first centuries are isolated using a chemical model of the stratosphere. The future evolution of ozone will depend on each of these gases, with N(2)O and CO(2) probably playing the dominant roles as halocarbons return towards pre-industrial levels. There are nonlinear interactions between these gases that preclude unambiguously separating their effect on ozone. For example, the CH(4) increase during the twentieth century reduced the ozone losses owing to halocarbon increases, and the N(2)O chemical destruction of O(3) is buffered by CO(2) thermal effects in the middle stratosphere (by approx. 20% for the IPCC A1B/WMO A1 scenario over the time period 1900-2100). Nonetheless, N(2)O is expected to continue to be the largest anthropogenic emission of an O(3)-destroying compound in the foreseeable future. Reductions in anthropogenic N(2)O emissions provide a larger opportunity for reduction in future O(3) depletion than any of the remaining uncontrolled halocarbon emissions. It is also shown that 1980 levels of O(3) were affected by halocarbons, N(2)O, CO(2) and CH(4), and thus may not be a good choice of a benchmark of O(3) recovery.


Figures
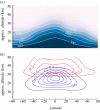
Figure 1.
Figure 1.
(a) The N2O field (in ppbv) produced by the NOCAR two-dimensional model in year 2000. (b) Production of NOx from N2O (reaction (2.3), blue contours) and chemical loss rates of NOx (reaction (2.4), red contours) in year 2000 (in ppbv d−1).
Figure 2.
Figure 2.
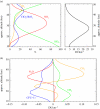
(a) The left panel shows the relative global mean ozone loss rates by chemical family computed for 2000 levels of source gases by the NOCAR two-dimensional model. The right panel shows the global mean ozone profile, which highlights the ozone layer maximum in the middle stratosphere. (b) The ozone changes by surface boundary condition perturbation for the following perturbation levels: 20 ppbv N2O, 100 pptv CFC-11, 250 ppbv CH4 and 50 ppmv CO2. The background atmosphere is defined to be at 2000 levels for the non-perturbed gases according to the combined IPCC A1B/WMO A1 scenario. Note that Dobson Units (DU) are a measure of ozone column amount (1 DU = 2.69 × 10¹⁶ mol cm−2) and DU km−1 is a density unit (1 DU km−1 = 2.69 × 10¹¹ mol cm−3).
Figure 3.
Figure 3.
The global mean ozone time series computed with the NOCAR two-dimensional model using the IPCC A1B/WMO A1 scenario. The global mean ozone levels from satellite observations from the NIWA analysis [22] are shown by the crosses. The year when the Montreal Protocol limited halocarbon emissions is indicated. Global mean ozone shows a super-recovery (an evolution to larger values than in the past) in this scenario caused primarily by CO2-induced changes on stratospheric temperatures. Solid line, model; plus symbols, satellite observations.
Figure 4.
Figure 4.
The individual source gas changes are isolated using different atmospheric base states (constant 1900 source gas levels and the combined IPCC A1B/WMO A1 scenario). In all cases, the size of the perturbation is obtained from the A1B/A1 scenario (dashed lines) minus constant 1900 source gas levels (solid lines). The degree to which the solid and dashed lines are different (for each gas) indicates the level of nonlinear interactions between the gases. These limit our ability to unambiguously separate the effect of these gases on ozone.
Figure 5.
Figure 5.
The ODP-weighted emission of anthropogenic N2O (red) and the listed halocarbons for 1987 (grey) and 2008 (blue) emission levels. The ODP-weighted emission (i.e. the ODP multiplied by the emission level) is proportional to the total future global mean ozone loss from the emission (assuming no intervening changes). The ODP-weighted emission of N2O was large even in 1987 when anthropogenic halocarbon emissions were near their peak and is larger than the individual halocarbons by 2008. Adapted from fig. 1 of Ravishankara et al. [26].
Figure 6.
Figure 6.
The changes in global mean ozone relative to 1950 computed with the NOCAR two-dimensional model. The full A1B/A1 scenario (labelled baseline) is shown along with scenarios that include removing the remaining unregulated halocarbon (i.e. ODS) emissions after 2010 and eliminating all anthropogenic N2O emissions after 2010. The effect of eliminating future unregulated halocarbon emissions would increase ozone levels until approximately 2070, while the elimination of anthropogenic N2O emissions has a larger effect by the end of the twenty-first century. The evolution of ozone without either anthropogenic halocarbon or N2O emissions is shown by the red line, to which the green curve will slowly converge. Adapted from fig. 2 of Daniel et al. [28].
Figure 7.
Figure 7.
The changes in global mean ozone owing to elimination of anthropogenic N2O emissions after 2010 when compared with the effect of eliminating the emissions of the CFC banks, HCFC production and banks, the halon banks, anthropogenic methyl bromide and carbon tetrachloride. The elimination of anthropogenic N2O emission has the largest potential for reducing ozone depletion in the future. Adapted from fig. 4 of Daniel et al. [28].

References

    1. Crutzen P. J. 1970. The influence of nitrogen oxide on the atmospheric ozone content. Q. J. R. Meteorol. Soc. 96, 320–32710.1002/qj.49709640815 (doi:10.1002/qj.49709640815) - DOI - DOI
    1. Johnston H. S. 1971. Reduction of stratospheric ozone by nitrogen oxide catalysts from supersonic transport exhaust. Science 173, 517–52210.1126/science.173.3996.517 (doi:10.1126/science.173.3996.517) - DOI - DOI - PubMed
    1. Molina M. J., Rowland F. S. 1974. Stratospheric sink for chlorofluoromethanes: chlorine atomic-catalysed destruction of ozone. Nature 249, 810–81210.1038/249810a0 (doi:10.1038/249810a0) - DOI - DOI
    1. Stolarski R. S., Cicerone R. J. 1974. Stratospheric chlorine: possible sink for ozone. Can. J. Chem. 52, 1610–161510.1139/v74-233 (doi:10.1139/v74-233) - DOI - DOI
    1. Farman J., Gardiner B., Shanklin J. 1985. Large losses of total ozone in Antarctica reveal seasonal ClOx/NOx interaction. Nature 315, 207–21010.1038/315207a0 (doi:10.1038/315207a0) - DOI - DOI

LinkOut - more resources