

Association between bone mineral density and type 2 diabetes mellitus: a meta-analysis of observational studies
- PMID: 22451239
- PMCID: PMC3374119
- DOI: 10.1007/s10654-012-9674-x
Association between bone mineral density and type 2 diabetes mellitus: a meta-analysis of observational studies
Abstract
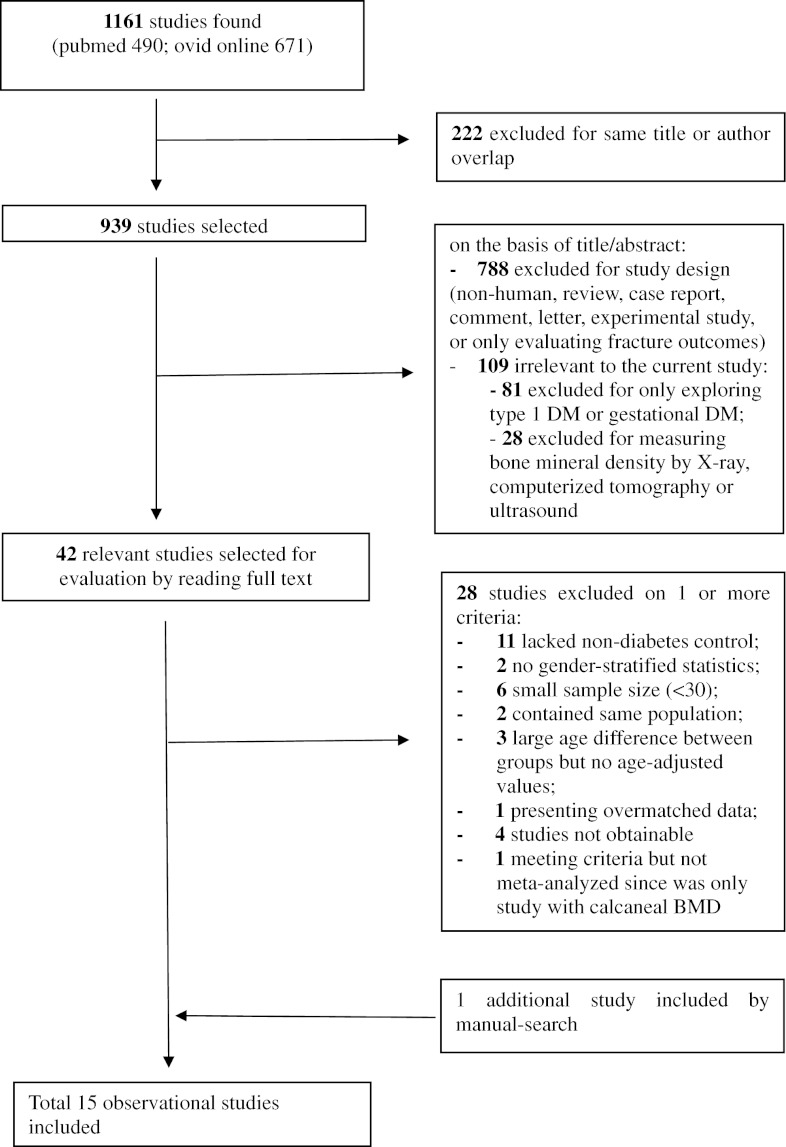
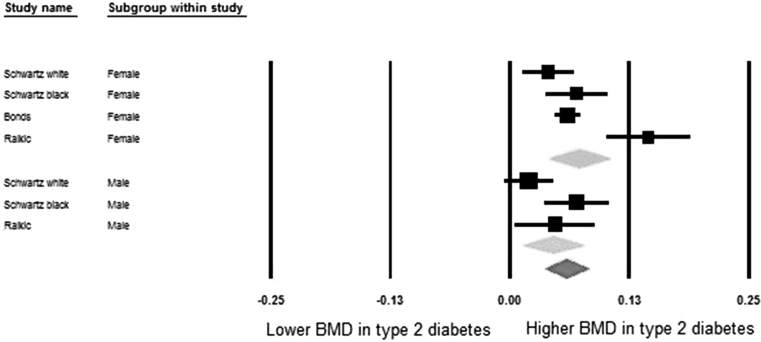
Type 2 diabetes mellitus (T2DM) influences bone metabolism, but the relation of T2DM with bone mineral density (BMD) remains inconsistent across studies. The objective of this study was to perform a meta-analysis and meta-regression of the literature to estimate the difference in BMD (g/cm(2)) between diabetic and non-diabetic populations, and to investigate potential underlying mechanisms. A literature search was performed in PubMed and Ovid extracting data from articles prior to May 2010. Eligible studies were those where the association between T2DM and BMD measured by dual energy X-ray absorptiometry was evaluated using a cross-sectional, cohort or case-control design, including both healthy controls and subjects with T2DM. The analysis was done on 15 observational studies (3,437 diabetics and 19,139 controls). Meta-analysis showed that BMD in diabetics was significantly higher, with pooled mean differences of 0.04 (95% CI: 0.02, 0.05) at the femoral neck, 0.06 (95% CI: 0.04, 0.08) at the hip and 0.06 (95% CI: 0.04, 0.07) at the spine. The differences for forearm BMD were not significantly different between diabetics and non-diabetics. Sex-stratified analyses showed similar results in both genders. Substantial heterogeneity was found to originate from differences in study design and possibly diabetes definition. Also, by applying meta-regression we could establish that younger age, male gender, higher body mass index and higher HbA(1C) were positively associated with higher BMD levels in diabetic individuals. We conclude that individuals with T2DM from both genders have higher BMD levels, but that multiple factors influence BMD in individuals with T2DM.
Figures


References
-
- Albright F, Reifenstein EC. The parathyroid glands and metabolic bone disease: selected studies. Baltimore: Williams and Wilkins; 1948.
-
- Saller A, Maggi S, Romanato G, Tonin P, Crepaldi G. Diabetes and osteoporosis. Aging Clin Exp Res. 2008;20(18852539):280–289. - PubMed
-
- van Daele PL, Stolk RP, Burger H, et al. Bone density in non-insulin-dependent diabetes mellitus. The Rotterdam Study. Ann Intern Med. 1995;122(7856988):409–414. - PubMed
-
- Yaturu S, Humphrey S, Landry C, Jain SK. Decreased bone mineral density in men with metabolic syndrome alone and with type 2 diabetes. Med Sci Monit. 2009;15(19114969):5–9. - PubMed
Publication types
MeSH terms
Substances
LinkOut - more resources
Full Text Sources
Medical
Miscellaneous
