. 2012;29(3):571-88.
doi: 10.3233/JAD-2012-111223.

Genome-wide DNA methylation differences between late-onset Alzheimer's disease and cognitively normal controls in human frontal cortex

Affiliations

Genome-wide DNA methylation differences between late-onset Alzheimer's disease and cognitively normal controls in human frontal cortex

Kelly M Bakulski et al. J Alzheimers Dis. 2012.

Abstract

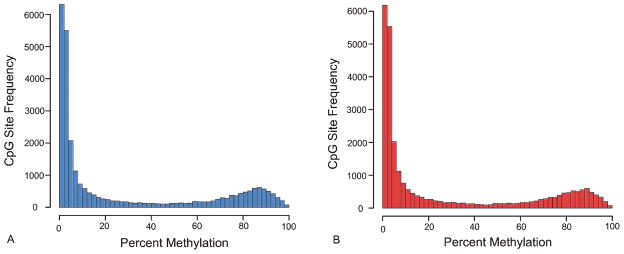
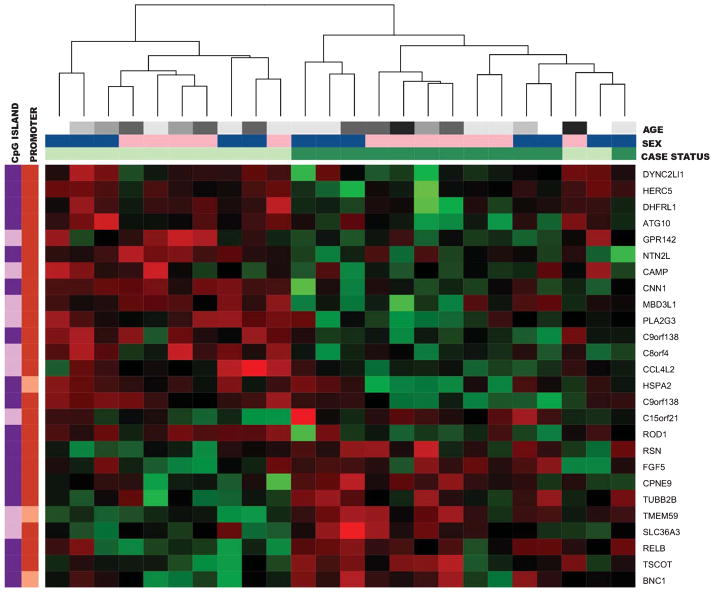
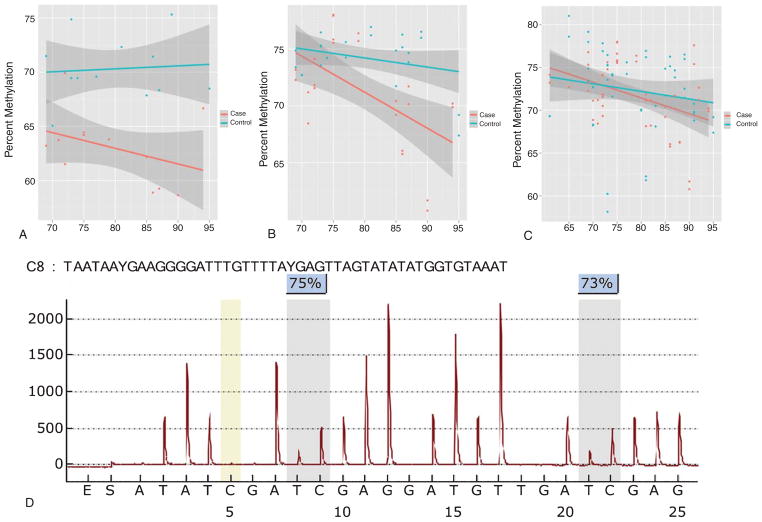
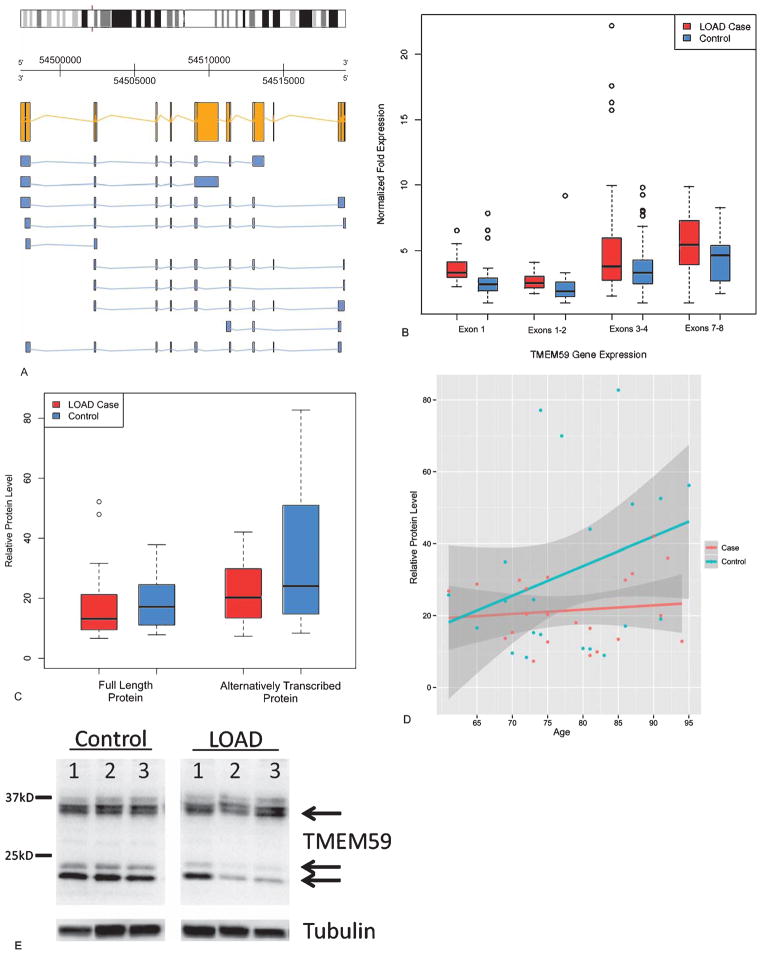
Evidence supports a role for epigenetic mechanisms in the pathogenesis of late-onset Alzheimer's disease (LOAD), but little has been done on a genome-wide scale to identify potential sites involved in disease. This study investigates human postmortem frontal cortex genome-wide DNA methylation profiles between 12 LOAD and 12 cognitively normal age- and gender-matched subjects. Quantitative DNA methylation is determined at 27,578 CpG sites spanning 14,475 genes via the Illumina Infinium HumanMethylation27 BeadArray. Data are analyzed using parallel linear models adjusting for age and gender with empirical Bayes standard error methods. Gene-specific technical and functional validation is performed on an additional 13 matched pair samples, encompassing a wider age range. Analysis reveals 948 CpG sites representing 918 unique genes as potentially associated with LOAD disease status pending confirmation in additional study populations. Across these 948 sites the subtle mean methylation difference between cases and controls is 2.9%. The CpG site with a minimum false discovery rate located in the promoter of the gene Transmembrane Protein 59 (TMEM59) is 7.3% hypomethylated in cases. Methylation at this site is functionally associated with tissue RNA and protein levels of the TMEM59 gene product. The TMEM59 gene identified from our discovery approach was recently implicated in amyloid-β protein precursor post-translational processing, supporting a role for epigenetic change in LOAD pathology. This study demonstrates widespread, modest discordant DNA methylation in LOAD-diseased tissue independent from DNA methylation changes with age. Identification of epigenetic biomarkers of LOAD risk may allow for the development of novel diagnostic and therapeutic targets.


Figures

Fig. 1
Fig. 1
Mean percent methylation frequency distribution of the Discovery Set of 12 cognitively normal control samples (A) and 12 Alzheimer’s disease cases (B) across the 27,578 CpG sites on the Illumina HumanMethylation27 BeadArray.
Fig. 2
Fig. 2
Hierarchical clustering heatmap of the Discovery Set top 26 autosomal CpG loci associated with late-onset Alzheimer’s disease (LOAD) case/control status after adjusting for sex and age. Green represents hypermethylation in LOAD cases and red represents hypomethylation in cases. Horizontal color bars at the top refer to the age, sex, and case status of the sample. In the Case Status color bar, light green represents control samples and dark green represents LOAD cases. For sex, female is light pink and male is dark blue. In the age panel, black represents ages 91–95, darkest gray 86–90, medium gray 81–85, light gray 76–80, lightest gray 71–75, and white represents ages 66–70. Vertical color bars on the left refer to the CpG island and promoter status of the CpG sites. In the CpG island bar, dark purple represents sites within CpG islands and light purple represents sites outside of CpG islands. In the promoter bar, dark orange represents sites within promoter regions and light orange represents sites outside of promoter regions.
Fig. 3
Fig. 3
Discovery Set gene set enrichment analysis plots. A) Genes associated with RNA polymerase II transcription factor activity molecular function were hypermethylated in LOAD cases relative to controls (p = 0.013). B) Genes associated with carboxylic acid metabolic biological processes were hypomethylated in LOAD cases relative to controls (p = 0.013).
Fig. 4
Fig. 4
Human chromosome ideogram in black. Distribution of CpG sites featured on the Illumina HumanMethylation27 BeadArray is below the chromosomes in blue. Distribution of CpG sites that were significantly associated with late-onset Alzheimer’s disease (LOAD) in the Discovery Set are above the ideograms. Green represents hypermethylation with LOAD status. Red represents hypomethylation with LOAD status.
Fig. 5
Fig. 5
Methylation upstream of the TMEM59 gene. A) Percent methylation by age and case status (Late-Onset Alzheimer’s Disease cases in red; Controls in blue). Data from the Illumina HumanMethylation27 BeadArray. B) Age versus percent methylation bisulfite-pyrosequencing technical validation data of original 24 samples run in duplicate in the Discovery Set. C) Age versus percent methylation bisulfite pyrosequencing of Discovery Set 24 samples plus 26 additional population validation samples run in duplicate. D) A representative bisulfite-pyrosequencing assay pyrogram for 2 CpG sites in the promoter of TMEM59.
Fig. 6
Fig. 6
Functional validation of observed DNA methylation differences for TMEM59, a gene involved in the post-translational modification of AβPP. A) TMEM59 is located on chromosome 1 and is transcribed on the reverse strand. The reference sequence mRNA is yellow. Predicted alternative isoforms are in blue. B) Boxplot of TMEM59 gene expression by Q-PCR in the Discovery Set. Two-sample t-test between cases and controls were all statistically significant (exon 1 p = 0.0013; exons 1–2 p = 0.0071; exons 3–4 p = 0.0036, exons 7–8 p = 0.0083). C) Boxplot of relative protein levels of TMEM59 in the Discovery Set plus an additional 26 validation samples. Paired t-tests did not reflect case specific differences for the full length protein (p = 0.68), while the shorter protein fragment was significantly lower in AD cases (p = 0.040). D) Levels of the shorter TMEM59 protein fragment as a function of age. E) Representative western blot image of TMEM59 protein expression in controls and AD cases 1–3 representing identical exposures of the same gel. No differences were detected between AD and controls for full length TMEM59 protein based on case status, but the levels of the TMEM59 shorter proteins were reduced in AD cases. These shorter proteins were also observed in the TMEM59 control protein lysate.

References

    1. Alzheimer’s Disease International. World Alzheimer Report 2010: The global economic impact of dementia. 2010 http://www.alz.co.uk/research/files/WorldAlzheimer-Report2010.pdf.
    1. Bird TD. Genetic factors in Alzheimer’s disease. N Engl J Med. 2005;352:862–864. - PubMed
    1. Bertram L. Alzheimer’s disease genetics current status and future perspectives. Int Rev Neurobiol. 2009;84:167–184. - PubMed
    1. Hardy J. Amyloid, the presenilins and Alzheimer’s disease. Trends Neurosci. 1997;20:154–159. - PubMed
    1. Kim J, Basak JM, Holtzman DM. The role of apolipoprotein E in Alzheimer’s disease. Neuron. 2009;63:287–303. - PMC - PubMed

Publication types

MeSH terms