. 2012 Oct;47(10):1001-11.
doi: 10.1002/ppul.22560. Epub 2012 Mar 26.

Macrophage migration inhibitory factor gene polymorphisms and plasma levels in children with obstructive sleep apnea

Affiliations

Macrophage migration inhibitory factor gene polymorphisms and plasma levels in children with obstructive sleep apnea

Abdelnaby Khalyfa et al. Pediatr Pulmonol. 2012 Oct.

Abstract

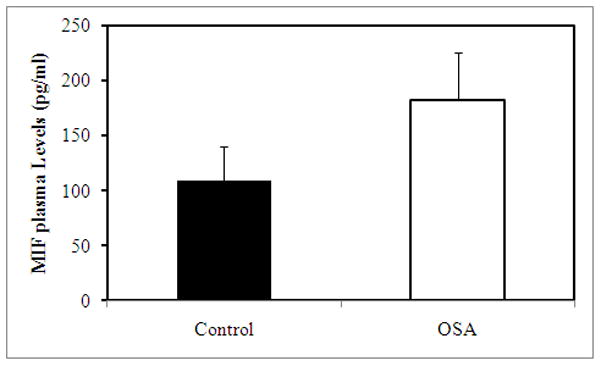
Introduction: Obstructive sleep apnea (OSA) is associated with increased risk for cardiovascular and metabolic dysfunction in both adults and children. In adults with OSA, serum levels of macrophage migration inhibitory factor (MIF) are elevated. Therefore, we assessed plasma MIF levels and MIF allelic variant frequencies in children with and without OSA (NOSA).

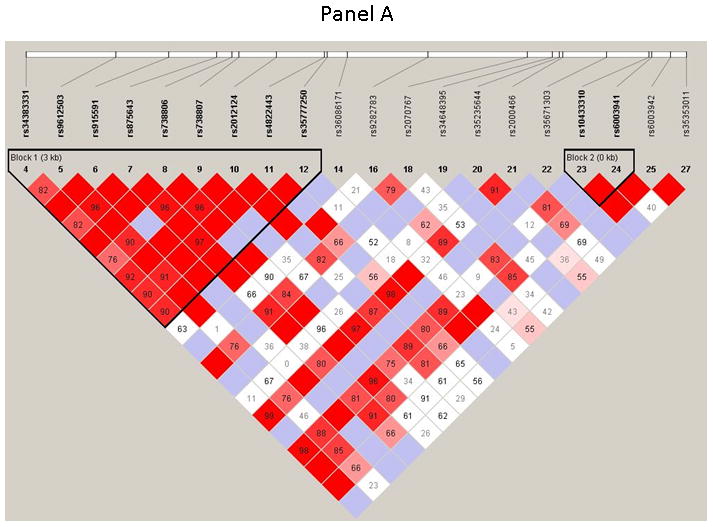
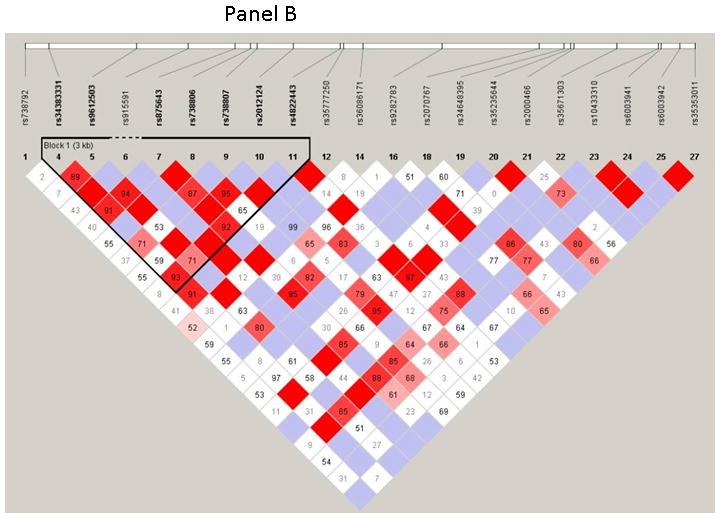
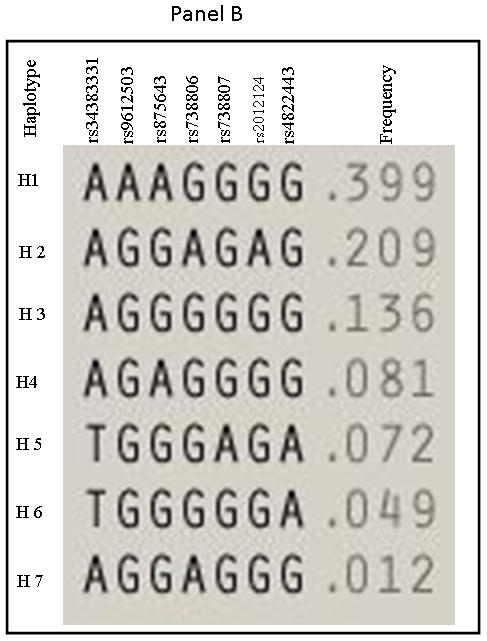
Methods: A total of 614 consecutive children ages 5-8 years were recruited. Children were divided into those with OSA and NOSA based on the apnea-hypopnea index (AHI). In addition to lipid profile, hsCRP, and fasting insulin and glucose levels, plasma MIF levels were assayed using ELISA, and 28 single nucleotide polymorphisms (SNPs) covering the region were genotyped. Linkage disequilibrium and haplotype blocks were analyzed using Haploview version 4.2 software.

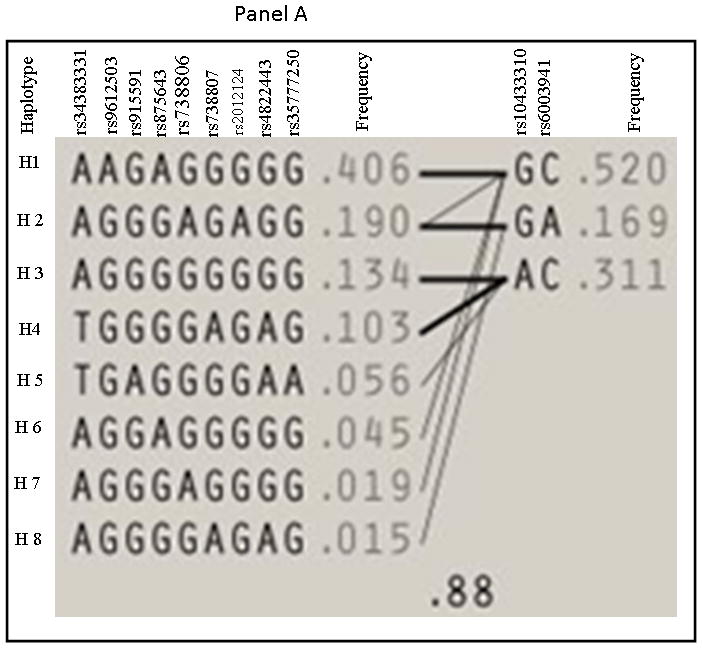
Results: Morning plasma MIF levels were increased in children with OSA. Of the 28 SNPs tested, the frequency of rs10433310 minor allele was significantly decreased in OSA. This SNP was also associated with reduced fasting insulin and hsCRP levels in OSA. The minor allele frequency of all other 27 SNPs was similar in OSA and NOSA groups.

Conclusions: Childhood OSA is associated with higher plasma MIF, hsCRP, and fasting insulin levels that promote cardiometabolic risk, and the MIF gene SNP rs10433310 may account for some of the variance in such risk.


Figures

Figure 1
Figure 1. Fasting morning concentrations of MIF plasma levels in NOSA and OSA subjects
OSA vs. NOSA:p<0.02
Figure 2
Figure 2. Pairwise linkage disequilibrium (LD) structure and 28 SNPS of the MIF gene
Panel (A) represents control children (NOSA), and Panel (B) represents children with OSA. LD map of MIF gene region chr22:22556987–22576986 was depicted using 28 SNPs (MAF >0.05) in HapMap database. The plot was generated using Haploview 4.2 with D′ Color Scheme (D′=0, D′<1 and D′=1 were shown by white, shades of pink and red (respectively) and pairwise r2 values shown in diamonds. The value within each diamond represents the pair-wise LD (correlation, measured as D′) between the two SNPs defined by the top left and the top right of the diamond. Solid lines represent SNPs that were used in the haplotype analysis and are part of the haplotype from SNP block whereas dashed lines represent SNPs that were used in the analysis, but were not part of the haplotype.
Figure 3
Figure 3. Haplotype frequencies in NOSA and OSA children
Panel A represents haplotype for NOSA and Panel B represents haplotype for OSA children.
Figure 3
Figure 3. Haplotype frequencies in NOSA and OSA children
Panel A represents haplotype for NOSA and Panel B represents haplotype for OSA children.

References

    1. Capdevila OS, Dayyat E, Kheirandish-Gozal L, Gozal D. Prevalence of epileptiform activity in healthy children during sleep. Sleep Med. 2008;9(3):303–309. - PubMed
    1. Gozal D. Obstructive sleep apnea in children: implications for the developing central nervous system. Semin Pediatr Neurol. 2008;15(2):100–106. - PMC - PubMed
    1. Dayyat E, Kheirandish-Gozal L, Gozal D. Childhood Obstructive Sleep Apnea: One or Two Distinct Disease Entities? Sleep Med Clin. 2007;2(3):433–444. - PMC - PubMed
    1. Kheirandish-Gozal L, Bhattacharjee R, Kim J, Clair HB, Gozal D. Endothelial progenitor cells and vascular dysfunction in children with obstructive sleep apnea. Am J Respir Crit Care Med. 2010;182(1):92–97. - PMC - PubMed
    1. Bhattacharjee R, Kheirandish-Gozal L, Pillar G, Gozal D. Cardiovascular complications of obstructive sleep apnea syndrome: evidence from children. Prog Cardiovasc Dis. 2009;51(5):416–433. - PubMed

Publication types

MeSH terms