. 2012 May;32(10):1879-92.
doi: 10.1128/MCB.06214-11. Epub 2012 Mar 26.

Inhibition of Mcl-1 promotes senescence in cancer cells: implications for preventing tumor growth and chemotherapy resistance

Affiliations

Inhibition of Mcl-1 promotes senescence in cancer cells: implications for preventing tumor growth and chemotherapy resistance

Elzbieta Bolesta et al. Mol Cell Biol. 2012 May.

Abstract

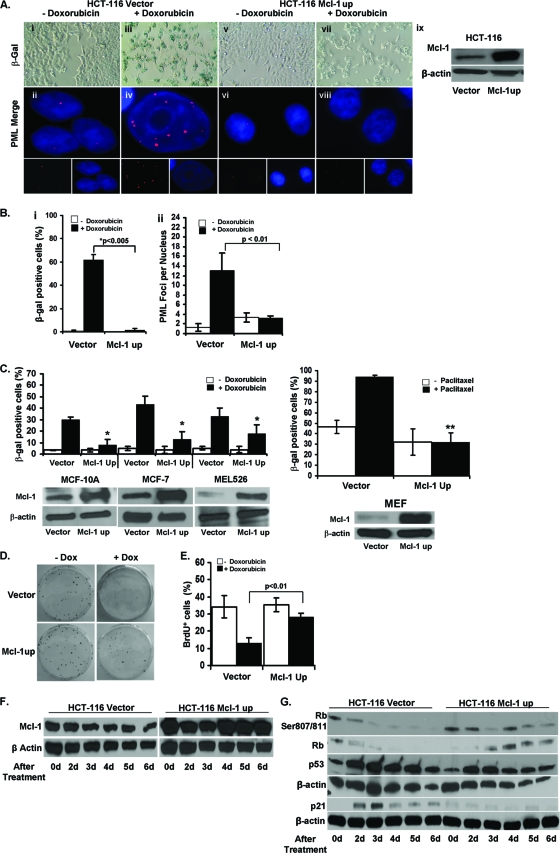
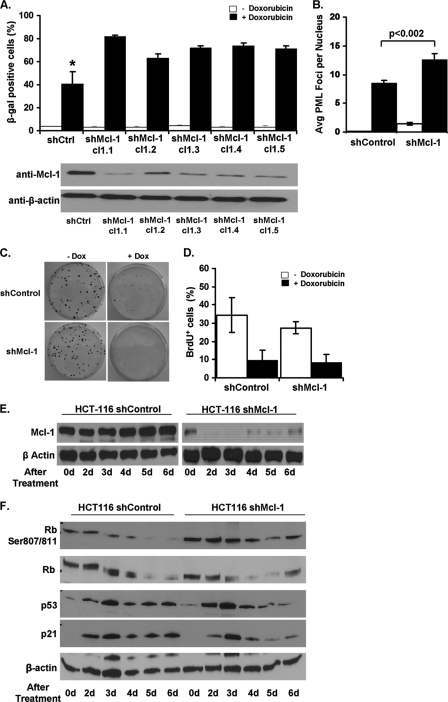
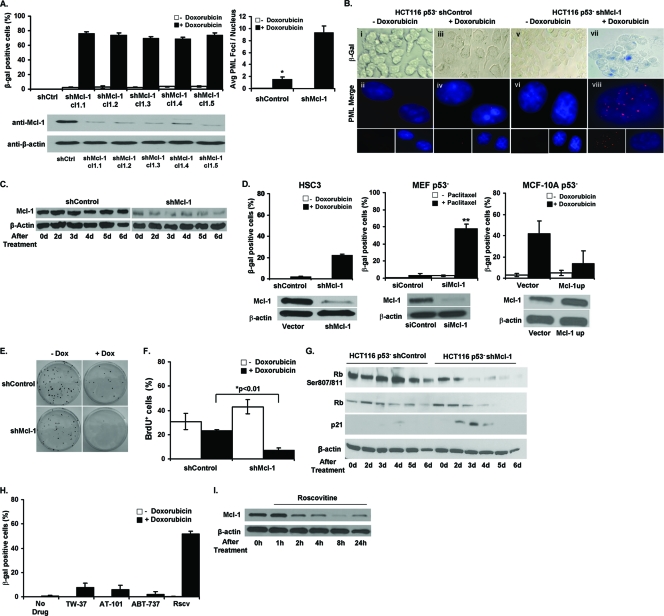
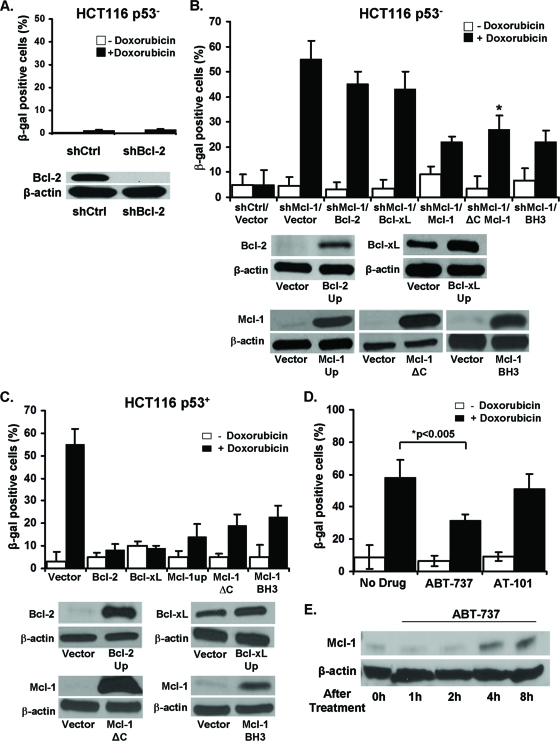
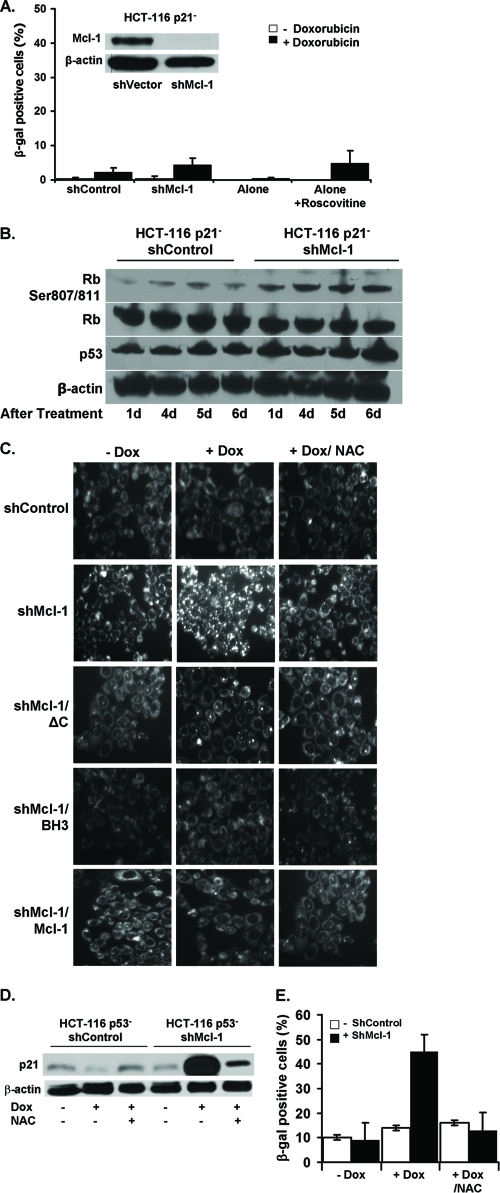
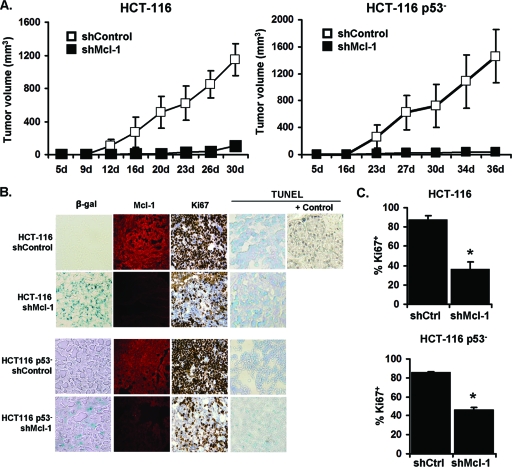
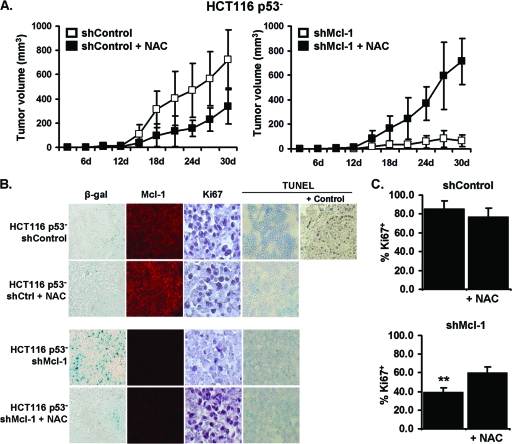
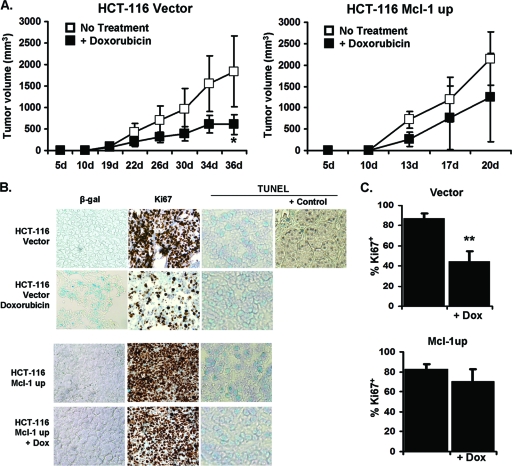
Although senescence in oncogenesis has been widely studied, little is known regarding the role of this process in chemotherapy resistance. Thus, from the standpoint of enhancing and improving cancer therapy, a better understanding of the molecular machinery involved in chemotherapy-related senescence is paramount. We show for the first time that Mcl-1, a Bcl-2 family member, plays an important role in preventing chemotherapy-induced senescence (CIS). Overexpression of Mcl-1 in p53⁺ cell lines inhibits CIS. Conversely, downregulation of Mcl-1 makes cells sensitive to CIS. Surprisingly, downregulation of Mcl-1 in p53⁻ cells restored CIS to similar levels as p53⁺ cells. In all cases where senescence can be induced, we observed increased p21 expression. Moreover, we show that the domain of Mcl-1 responsible for its antisenescent effects is distinct from that known to confer its antiapoptotic qualities. In vivo we observe that downregulation of Mcl-1 can almost retard tumor growth regardless of p53 status, while overexpression of Mcl-1 in p53⁺ cells conferred resistance to CIS and promoted tumor outgrowth. In summary, our data reveal that Mcl-1 can inhibit CIS in both a p53-dependent and -independent manner in vitro and in vivo and that this Mcl-1-mediated inhibition can enhance tumor growth in vivo.


Figures

Fig 1
Fig 1
Overexpression of Mcl-1 in HCT116 cells abrogates CIS. (A) SA-β-gal staining of HCT116 vector and Mcl-1up cells grown with or without 100 ng/ml doxorubicin (Dox) for 6 days (panels i, iii, v, vii) (magnification, ×100). HCT116 vector and Mcl-1up cells grown with or without doxorubicin for 4 days, followed by staining with anti-PML antibody and secondary antibody conjugated to Cy3 (red) and nuclei counterstained with DAPI (panels ii, iv, vi, viii) (magnification, ×100). Western blot verifying overexpression of Mcl-1. (B) Percentages of SA-β-gal+ cells among HCT116 vector and Mcl-1up cells after 6 days with and without doxorubicin (panel i). Values represent the mean and standard error of the mean (SEM) of at least 3 independent experiments. PML bodies per nucleus in HCT116 vector and Mcl-1up cells after 4 days with or without doxorubicin (panel ii). Values represent the mean and SEM of at least three independent experiments. **, P value of <0.05 between treated and untreated HCT116 vector cells using a Mann-Whitney statistical test. (C) Percentages of SA-β-gal+ cells among MCF-10A, MCF-7, MEL526, and mouse embryonic fibroblast (MEF) cells transformed with either vector or Mcl-1up after 6 days treated with and without doxorubicin or 10 μM paclitaxel in the case of the MEFs. Values represent the mean ±SEM of at least three independent experiments. *, P value of <0.01 compared to doxorubicin-treated vector control cells of each type. **, P value of <0.001 between doxorubicin-treated vector and Mcl-1up MEF cells. Western blots verifying overexpression of Mcl-1 in the indicated cell lines. (D) Colony formation by HCT116 vector and Mcl-1up cells growing with or without doxorubicin. (E) Quantification of BrdU incorporation by HCT116 vector and Mcl-1up cells. Values represent the mean and standard deviation (SD) of at least 3 independent experiments. (F) Mcl-1 expression in HCT116 cells was verified by Western blotting at the indicated time points after treatment with 100 ng/ml doxorubicin. (G) Western blot analysis of indicated protein expression in untreated cells (0 days) and 2, 3, 4, 5, and 6 days following doxorubicin treatment.
Fig 2
Fig 2
Downregulation of Mcl-1 expression in HCT116 cells enhances CIS. (A) Percentages of SA-β-gal+ HCT116 cells expressing shMcl-1 (or a nonspecific control) after 6 days of growth with or without 100 ng/ml doxorubicin (Dox). Represented on the graph are five independently generated shMcl-1 clones. Clone 1.1 (cl1.1) was used in subsequent experiments. Western blot analysis verifying Mcl-1 knockdown in each of the five shMcl-1 clones. (B) Average number of PML bodies per nucleus with or without doxorubicin for 4 days. Values represent the mean ± SD of at least three independent experiments. (C) Colony formation by HCT116 shControl and shMcl-1 cells growing with or without doxorubicin. (D) Quantification of BrdU incorporation. Values represent the mean ± SD of at least three independent experiments. (E) Western blot analysis of Mcl-1 protein expression in untreated cells (0 days) or 2, 3, 4, 5, and 6 days following doxorubicin treatment. (F) Western blot analysis of the indicated proteins in HCT116 shControl and shMcl-1 cells after doxorubicin treatment for 0, 2, 3, 4, 5, and 6 days.
Fig 3
Fig 3
Downregulation of Mcl-1 in HCT116 p53 cells allows for the induction of CIS. (A) Percentages of SA-β-gal+ HCT116 p53 shControl and 5 shMcl-1 clones after 6 days of growth in media with or without doxorubicin (Dox). Clone 1.1 (cl1.1) was used in subsequent experiments. Western blot analysis of Mcl-1 expression in shControl or shMcl-1 clones after 6 days of treatment with doxorubicin. Average number of PML bodies per nucleus in HCT116 p53 cells with or without doxorubicin for 4 days. Values represent the mean ±SD of at least three independent experiments. (B) SA-β-gal+ HCT116 p53 shControl and shMcl-1 cells after culture with or without 100 ng/ml doxorubicin for 6 days (panels i, iii, v, vii) (magnification, ×40). PML body staining (red) of HCT116 p53 vector and HCT116 Mcl-1up cells grown with or without doxorubicin for 6 days (panels ii, iv, vi, viii). Nuclei were counterstained with DAPI (magnification, ×100). Micrographs are representative of at least 3 independent experiments. (C) Western blot analysis of Mcl-1 expression in shControl or shMcl-1 cells left untreated (0 days) or 2, 3, 4, 5, and 6 days following doxorubicin treatment. (D) Percentages of SA-β-gal+ cells among various p53 cell lines possessing altered Mcl-1 expression after 6 days treatment with either doxorubicin (HSC3 and MCF-10A) or paclitaxel (MEF). Values represent the mean ± SD of at least three independent experiments. **, P value of <0.001 for paclitaxel-treated siMcl-1 MEFs compared to treated siControl cells. Western blots indicating Mcl-1 expression in each cell line appear below each graph. (E) Colony formation by HCT116 p53 shControl and shMcl-1 cells growing in media with or without doxorubicin. (F) Quantification of BrdU incorporation. Values represent the mean ± SD of at least three independent experiments. *, P value of <0.01 for doxorubicin-treated shMcl-1 cells compared to treated shControl cells. (G) Western blot analysis of the expression of the indicated proteins in p53 shControl and shMcl-1 cells left untreated (0 days) or after 2, 3, 4, 5, and 6 days of treatment with doxorubicin. (H) Percentages of SA-β-gal+ HCT116 p53 cells after 6 days growing in media with or without doxorubicin in combination with TW-37 (2 nM), AT-101 (2.5 μM), ABT-737 (10 μM), or roscovitine (Rscv) (25 μM). Values represent the mean ± SD of at least three independent experiments. (I) Western blot analysis of Mcl-1 expression after treatment with roscovitine for the indicated time points.
Fig 4
Fig 4
Mcl-1 is unique among Bcl-2 family members in its ability to induce senescence in p53 cells. (A) Percentages of SA-β-gal+ HCT116 p53 cells expressing a shRNA specific for Bcl-2 or an irrelevant control after 6 days culture with or without doxorubicin. Western blot verification of the knockdown of Bcl-2 expression. (B) Percentages of SA-β-gal+ HCT116 p53 shControl cell line or HCT116 p53 shMcl-1 cell line plus vector control, overexpressing exogenous Bcl-2, Bcl-xL, Mcl-1, Mcl-1 with a deleted C-terminal/transmembrane mitochondrial targeting domain (Mcl-1ΔC), and Mcl-1 with a mutated BH3 binding groove (BH3) grown for 6 days with or without doxorubicin. Values represent the mean ± SD of at least three independent experiments. Western blot verification of exogenous gene expression in each cell line. (C) Percentages of SA-β-gal+ HCT116 p53+ cells with control vector or overexpressing exogenous Bcl-2, Bcl-xL, Mcl-1, Mcl-1ΔC, or BH3 mutant Mcl-1 grown in media for 6 days with or without doxorubicin. No significant differences were observed between normal Mcl-1 overexpression and the two mutant versions of the Mcl-1 molecule. Values represent the mean ± SD of at least three independent experiments. Western blot verification of protein overexpression in each cell line. (D) Percentages of SA-β-gal+ HCT116 cells after 6 days of growth in media alone or with ABT-737 or AT-101 and with or without doxorubicin. Values represent the mean ± SD of at least three independent experiments. (E) Western blot analysis of Mcl-1 expression after treatment with ABT-737 for the indicated time points.
Fig 5
Fig 5
Senescence induction in p53 cells requires p21 induction via a pathway involving reactive oxygen species (ROS) production. (A) The percentages of SA-β-gal+ HCT116 p21 cells expressing shControl, shMcl-1, alone, or treated with roscovitine after 6 days of culture in media with or without doxorubicin (Dox). (Inset) Western blot verifying knockdown of Mcl-1 in HCT116 p21 cells. (B) Western blot analysis of the indicated proteins in HCT116 p21 shControl or shMcl-1 cells at the indicated days after treatment with doxorubicin. (C) HCT116 p53 shControl or shMcl-1 cells alone or also expressing exogenous Mcl-1ΔC, Mcl-1 BH3 mutant, or Mcl-1 were pretreated with 5 μM NAC for 24 h followed by doxorubicin treatment for 6 days (magnification, ×20). Cells were then stained with RedoxSensor Red to visualize ROS production. (D) Cells were pretreated with NAC or left untreated for 24 h, followed by treatment with doxorubicin. After 6 days of treatment, lysates were prepared and assayed for p21 expression by Western blotting. (E) The percentages of SA-β-gal+ HCT116 p53 cells after 6 days of culture with or without doxorubicin in NAC pretreated or untreated cells.
Fig 6
Fig 6
Downregulation of Mcl-1 in HCT116 and HCT116 p53 induces senescence in vivo. (A) Growth curves of HCT116 shControl and shMcl-1 in athymic nude mice. A total of 1 × 10⁷ cells were injected subcutaneously into the right dorsal flank (n = 5). Data points are mean ± SD values of tumor volumes. (B) Immunohistology of HCT116 shControl and shMcl-1 xenograft tumors, staining for Mcl-1, Ki-67, and TUNEL analysis were done using formalin-fixed and frozen sections. (C) The percentage of Ki-67+ cells in the indicated tumor sections. Data are presented as mean ± SD. *, P value of <0.05 for Ki-67 expression in shMcl-1 cells compared to shControl. Data are indicative of three replicate experiments.
Fig 7
Fig 7
Antioxidant treatment of HCT116 p53 shMcl-1 tumors in vivo can enhance tumor growth. (A) Growth curves of HCT116 p53 shControl and shMcl-1 tumors implanted in athymic nude mice. A total of 1 × 10⁷ cells were injected subcutaneously into the right dorsal flank (n = 5). N-Acetylcysteine (NAC) treatment groups received drinking water containing 40 mM NAC. Marked are mean ± SD values of tumor volumes. (B) Immunohistology of indicated tumors after growth in nude mice. SA-β-gal, Mcl-1, Ki-67, and TUNEL staining was performed on formalin-fixed and frozen sections. (C) The percentage of Ki-67+ cells in tumor sections. Data are presented as mean ± SD. **, P value of <0.001 in NAC-treated shMcl-1 tumors compared to untreated shMcl-1. Data are indicative of three replicate experiments.
Fig 8
Fig 8
Overexpression of Mcl-1 in HCT116 prevents CIS in xenograft tumor-bearing nude mice. (A) Growth curves of HCT116 vector control or Mcl-1 overexpressing tumors in nude mice. A total of 1 × 10⁷ cells were injected into the right dorsal flank of female mice, and after 10 days, the animals were distributed into groups receiving PBS alone (no treatment) or 1.2 mg/kg of doxorubicin (Dox) in PBS every third day intraperitoneally (n = 5). Data points are mean ± SD values of tumor volumes. *, P value of <0.05 between doxorubicin-treated and untreated groups. (B) Immunohistology of HCT116 vector and Mcl-1up tumors. SA-β-gal, Ki-67, and TUNEL staining were done using formalin-fixed and frozen sections. (C) The percentage of Ki67+ cells was determined in the indicated tumor sections. Data are presented as mean ± SD. **, P value of <0.001 between the doxorubicin-treated and untreated vector control tumors. Data are representative of three independent studies.

References

    1. Bartkova J, et al. 2006. Oncogene-induced senescence is part of the tumorigenesis barrier imposed by DNA damage checkpoints. Nature 444:633–637 - PubMed
    1. Beauséjour CM, et al. 2003. Reversal of human cellular senescence: roles of the p53 and p16 pathways. EMBO J. 22:4212–4222 - PMC - PubMed
    1. Beroukhim R, et al. 2010. The landscape of somatic copy-number alteration across human cancers. Nature 463:899–905 - PMC - PubMed
    1. Braig M, et al. 2005. Oncogene-induced senescence as an initial barrier in lymphoma development. Nature 436:660–665 - PubMed
    1. Brunelle JK, Ryan J, Yecies D, Opferman JT, Letai A. 2009. MCL-1-dependent leukemia cells are more sensitive to chemotherapy than BCL-2-dependent counterparts. J. Cell Biol. 187:429–442 - PMC - PubMed

Publication types

Substances