. 2012 May 25;287(22):18524-34.
doi: 10.1074/jbc.M112.343681. Epub 2012 Mar 26.

The mechanistic basis for noncompetitive ibogaine inhibition of serotonin and dopamine transporters

Affiliations

The mechanistic basis for noncompetitive ibogaine inhibition of serotonin and dopamine transporters

Simon Bulling et al. J Biol Chem. .

Abstract

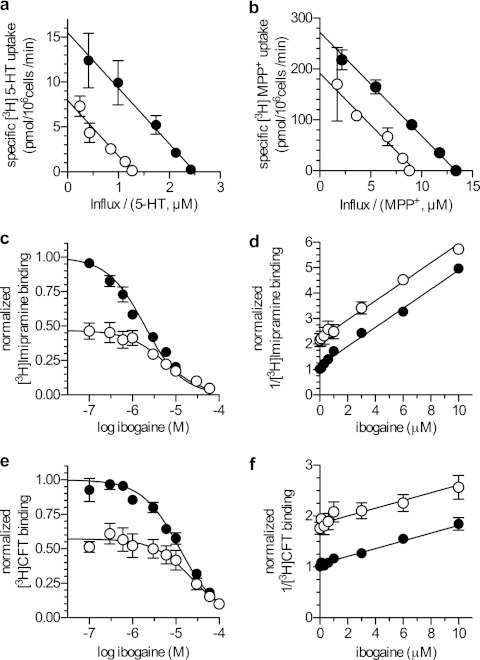
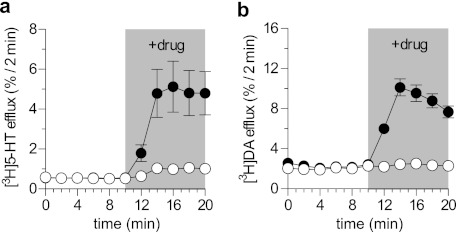
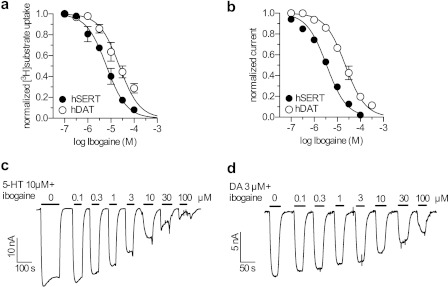
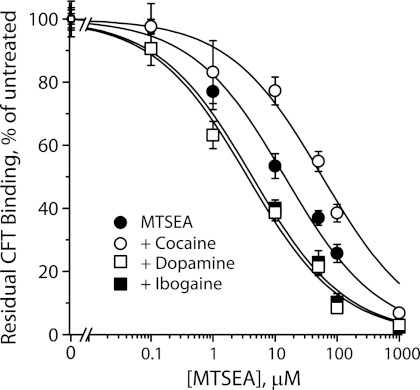
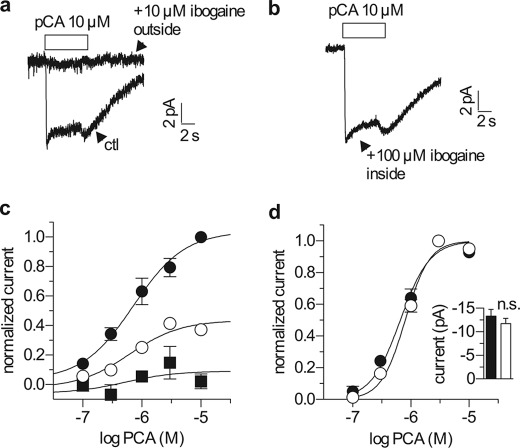
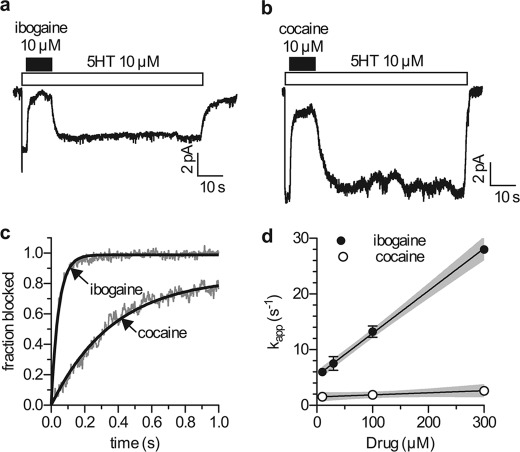
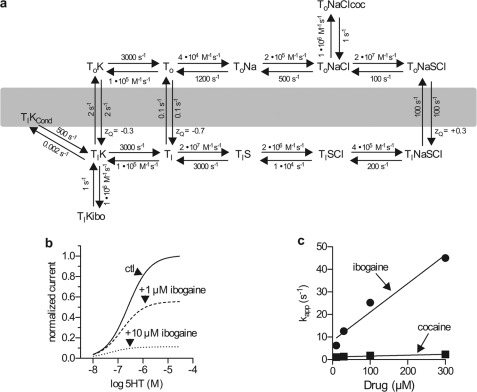
Ibogaine, a hallucinogenic alkaloid proposed as a treatment for opiate withdrawal, has been shown to inhibit serotonin transporter (SERT) noncompetitively, in contrast to all other known inhibitors, which are competitive with substrate. Ibogaine binding to SERT increases accessibility in the permeation pathway connecting the substrate-binding site with the cytoplasm. Because of the structural similarity between ibogaine and serotonin, it had been suggested that ibogaine binds to the substrate site of SERT. The results presented here show that ibogaine binds to a distinct site, accessible from the cell exterior, to inhibit both serotonin transport and serotonin-induced ionic currents. Ibogaine noncompetitively inhibited transport by both SERT and the homologous dopamine transporter (DAT). Ibogaine blocked substrate-induced currents also in DAT and increased accessibility of the DAT cytoplasmic permeation pathway. When present on the cell exterior, ibogaine inhibited SERT substrate-induced currents, but not when it was introduced into the cytoplasm through the patch electrode. Similar to noncompetitive transport inhibition, the current block was not reversed by increasing substrate concentration. The kinetics of inhibitor binding and dissociation, as determined by their effect on SERT currents, indicated that ibogaine does not inhibit by forming a long-lived complex with SERT, but rather binds directly to the transporter in an inward-open conformation. A kinetic model for transport describing the noncompetitive action of ibogaine and the competitive action of cocaine accounts well for the results of the present study.


Figures

FIGURE 1.
FIGURE 1.
Ibogaine inhibition of transport and binding by SERT and DAT. a, [3H]5-HT influx into cells stably expressing hSERT was measured in the absence (filled circles) or presence (open circles) of 10 μm ibogaine. The incubation time was 1 min and nonspecific uptake was measured in the presence of 10 μm paroxetine. b, [3H]MPP+ influx into cells stably expressing hDAT was measured as above using a 3-min incubation in the absence (filled circles) or presence (open circles) of 10 μm ibogaine. Nonspecific uptake was determined in the presence of 10 μm mazindol and was subtracted to the given values. The data in a and b are shown in form of Eadie-Hofstee plots, where the intercept on the y axis is equivalent to the Vmax and Km is given by the negative of the slope. For SERT the slopes at 0 and 10 μm ibogaine were statistically equivalent (p = 0.90 F test) and therefore globally fit with −6.18 ± 0.33 μm with a y intercepts of 15.51 ± 0.57 pmol/106 cells/min (R2 = 0.99) at 0 μm ibogaine and 7.92 ± 0.38 pmol/106 cells/min (R2 = 0.95) at 10 μm ibogaine. For DAT the slopes were also equivalent (p = 0.24 F test) and fit with −20.37 ± 0.8 μm with a y intercept of 272.30 ± 8.64 pmol/106 cells/min (R2 = 0.99) at 0 μm ibogaine and 191.70 ± 6.75 pmol/106 cells/min (R2 = 0.97) at 10 μm ibogaine. c–f, competition between ibogaine and 2 nm [3H]imipramine bound to SERT (c and d) and between ibogaine and 10 nm [3H]WIN35,428 bound to DAT (e and f) in the presence and absence of 10 μm 5-HT and DA, respectively. c, [3H]imipramine was displaced by ibogaine with an IC50 of 1.94 μm [1.71–2.21] (R2 = 0.95) in the absence of 5-HT and with an IC50 of 5.76 μm [3.72–9.00] (R2 = 0.85) in the presence of 10 μm 5-HT. 10 μm 5-HT reduced initial binding to 47% (95% confidence interval, 43–51). d, Dixon plot obtained by transformation of c. The slopes in d are 0.37 μm−1 (0.35–0.40) and are not statistically different (p = 0.38). e, [3H]WIN35,428 was displaced by ibogaine with an IC50 of 12.33 μm (10.46–14.54) (R2 = 0.99) in the absence of DA and with an IC50 of 23.14 μm (17.49–30.60) (R2 = 0.98) in the presence of 10 μm DA. 10 μm DA reduced initial binding to 57% (54–60). f, Dixon plot obtained by transformation of e. The slopes in f are 0.076 μm−1 (0.059–0.093) and are not statistically different (p = 0.50).
FIGURE 2.
FIGURE 2.
Ibogaine does not elicit an amphetamine-like releasing action in SERT and DAT. a and b, effect of ibogaine and PCA (a) or d-amphetamine (b) in a release assay. CAD cells transiently transfected with hSERT (a) or hDAT (b) were preloaded with [3H]5-HT or [3H]DA, and superfused with buffer. 2-min fractions were collected. Ibogaine (50 μm), PCA (3 μm), or d-amphetamine (3 μm) were added after six fractions (at time point 10) and five more 2-min fractions were collected (time points 12–20). Data are fractional release per 2 min in percent. Experiments were performed in quadruplicates; n = 2 (a), n = 3 (b).
FIGURE 3.
FIGURE 3.
Inhibition of substrate transport and induced currents by ibogaine. a, for transport, HEK-293 cells expressing hSERT (filled circles) or hDAT (open circles) were incubated with either 0.1 μm [3H]5-HT or 0.01 μm [3H]MPP+ for 1 or 3 min, respectively, in the presence of the indicated concentrations of ibogaine. The IC50 values for ibogaine inhibition of transport were 6.43 μm (5.03–8.21) R2 = 0.91 for SERT and 23.17 μm (17.76–30.23) R2 = 0.78 for DAT. b, measurements of substrate-induced currents were performed using two electrode voltage-clamp with X. laevis oocytes expressing hSERT (filled circles) or hDAT (open circles), clamped to a holding potential of −60 mV. Current was induced by addition of 10 μm 5-HT or 3 μm DA, respectively, and ibogaine was present at the indicated concentrations. The IC50 values for ibogaine inhibition of he substrate-induced current were 3.44 μm (3.10–3.86) R2 = 0.98 for SERT and 22.33 μm (19.32–25.80) R2 = 0.95 for DAT. c, current traces for 5-HT-induced currents and ibogaine inhibition of hSERT. Pulses of 10 μm 5-HT together with the indicated concentrations of ibogaine were applied to X. laevis oocytes expressing hSERT and the substrate-induced currents were measured by two electrode voltage-clamp. Data from this representative experiment and other similar trials were combined by calculating mean currents normalized to maximal substrate-induced inward current at 10 μm 5-HT in the absence of ibogaine, ± S.E., n = 6. The data shown in panel B (filled circles) shows the mean ± S.E. of these experiments. D, current traces for ibogaine inhibition of DAT currents induced by 3 μm DA, measured as in c using oocytes expressing hDAT.
FIGURE 4.
FIGURE 4.
Reactivity of the DAT cytoplasmic pathway is increased by ibogaine. Ser-262 in DAT, corresponding to the cytoplasmic pathway residue Ser-277 identified in SERT, was mutated to cysteine in the X5C background (42). Membrane fragments from HeLa cells expressing DAT X5C-S262C were treated with the indicated concentrations of MTSEA for 15 min in the presence or absence of 10 μm cocaine, 10 μm DA, or 20 μm ibogaine as indicated, and then assayed for residual [3H]CFT binding as previously described for SERT (43, 54). From the MTSEA concentrations required for half-maximal inactivation, the rate constants for inactivation were 82 ± 3 s−1 m−1 for MTSEA alone, 13 ± 2 s−1 m−1 in the presence of cocaine, 419 ± 36 s−1 m−1 with DA present, and 348 ± 95 s−1 m−1 in the presence of ibogaine. Results are mean ± S.E. from 3 independent experiments.
FIGURE 5.
FIGURE 5.
Ibogaine blocks substrate-induced currents only from the extracellular side. a, single hSERT expressing cells were voltage clamped to −70 mV using the whole cell patch clamp configuration and continuously superfused with buffer solution as described under “Experimental Procedures.” A 6-s pulse of 10 μm p-chloroamphetamine (a SERT substrate) was applied either in the absence (lower trace) or presence (upper trace) of 10 μm ibogaine in the extracellular medium. b, single hSERT expressing cells were voltage clamped and stimulated with PCA as in a, but with a pipette solution containing 100 μm ibogaine. c, single hSERT expressing cells were voltage clamped as in a and b and stimulated with a range of PCA concentrations. Once per minute they were challenged with a 5-s pulse of 10 μm PCA, either in the absence (filled circles) or after a 10-s pre-application of either 1 or 10 μm ibogaine (open circles and filled squares, respectively). Ibogaine reduced the maximal charge transfer to 0.44 ± 0.04 at 1 μm (n = 5) and 0.09 ± 0.08 at 10 μm (n = 5), whereas the EC50 of PCA was not changed (0.72 μm (0.34–1.55 μm) control (ctl) (n = 10); 0.62 μm (0.23–1.70 μm) at 1 μm ibogaine (n = 5); 0.52 μm (0.44 nm to 62.14 μm) at 10 μm ibogaine (n = 5). d, ibogaine did not influence the concentration response when present in the intracellular pipette solution. Single hSERT expressing cells were voltage clamped and stimulated with PCA as in c using either normal pipette solution (filled circles) or pipette solution containing 100 μm ibogaine (open circles). Ibogaine did not change the EC50 of PCA when applied from the inside (0.66 μm (0.55–0.79 μm) under control (n = 10); 0.80 μm (0.69–0.93 μm) with 100 μm ibogaine inside, n = 10). The inset shows a comparison of the current amplitudes induced by 10 μm PCA both in the absence (−13.3 pA ± 1.4 pA, filled column) and presence of 100 μm internal ibogaine (−11.7 ± 1.1 pA, open column) (p = 0.26, Mann-Whitney U test).
FIGURE 6.
FIGURE 6.
Kinetics of current block by ibogaine and cocaine. Single hSERT expressing cells were voltage clamped to −70 mm using the whole cell patch clamp technique. Cells were continuously superfused with buffer solution. a and b, for the evaluation of blocking kinetics cells were challenged with 5-HT (10 μm). 2 s after 5-HT addition, the blocking agent (ibogaine (a) or cocaine (b)) was applied for 10 s and then washed away for 60 s in the presence of 5-HT. c, comparison of the blocking kinetics of ibogaine (10 μm) and cocaine (10 μm). Gray lines indicate representative traces, and black lines show fits to the traces. d, analysis of the blocking kinetics of ibogaine (filled circles) and cocaine (open circles) over a range of concentrations. Rate constants for the development of the block were calculated over the concentration range and plotted against concentration. The black lines are linear fits through the data points and the gray areas indicate 95% confidence intervals. The slope for ibogaine was significantly different from zero (p < 0.0001 F test), 7.6 × 10⁴ ± 0.4 × 10⁴ s−1 m−1, and the y intercept was 5.3 ± 0.5 s−1. The slope for cocaine was 3 × 10³ ± 2 × 10³ s−1 m−1, which was not significantly different from zero (p = 0.16 F test), and the y intercept was 1.5 ± 0.4 s−1.
FIGURE 7.
FIGURE 7.
A kinetic model for cocaine and ibogaine inhibition of substrate-induced currents in SERT. a, the model was based on a kinetic model for 5-HT-induced currents (18). KD values of 1 μm were used for both cocaine (coc) and ibogaine (ibo) (4, 36). 5-HT is represented as S. Although cocaine binds in the absence of NaCl, and its affinity is not increased by Cl (36), binding was arbitrarily assigned to the ToNaCl intermediate to avoid undue complexity in the model. See supplemental data for a more complete analysis of the model. The slow K+-independent conversion of Ti to To is likely to represent H+ export as described previously (45). The conducting state is shown as TiKCond (18). b and c, simulations based on the model in a. b, simulated current amplitudes as a function of substrate concentration in the absence and presence of 1 and 10 μm ibogaine. c, simulated association rate constants (kapp) for ibogaine and cocaine as a function of their concentration.

References

    1. Leal M. B., Michelin K., Souza D. O., Elisabetsky E. (2003) Ibogaine attenuation of morphine withdrawal in mice. Role of glutamate N-methyl-d-aspartate receptors. Prog. Neuropsychopharmacol. Biol. Psychiatry 27, 781–785 - PubMed
    1. Levi M. S., Borne R. F. (2002) A review of chemical agents in the pharmacotherapy of addiction. Curr. Med. Chem. 9, 1807–1818 - PubMed
    1. Donnelly J. R. (2011) The need for ibogaine in drug and alcohol addiction treatment. J. Legal Med. 32, 93–114 - PubMed
    1. Jacobs M. T., Zhang Y. W., Campbell S. D., Rudnick G. (2007) Ibogaine, a noncompetitive inhibitor of serotonin transport, acts by stabilizing the cytoplasm-facing state of the transporter. J. Biol. Chem. 282, 29441–29447 - PubMed
    1. Wells G. B., Lopez M. C., Tanaka J. C. (1999) The effects of ibogaine on dopamine and serotonin transport in rat brain synaptosomes. Brain Res. Bull. 48, 641–647 - PubMed

Publication types

MeSH terms

Substances