. 2012 Apr 10;109(15):5880-5.
doi: 10.1073/pnas.1120841109. Epub 2012 Mar 26.

Loss of DNA methylation affects the recombination landscape in Arabidopsis

Affiliations

Loss of DNA methylation affects the recombination landscape in Arabidopsis

Marie Mirouze et al. Proc Natl Acad Sci U S A. .

Abstract

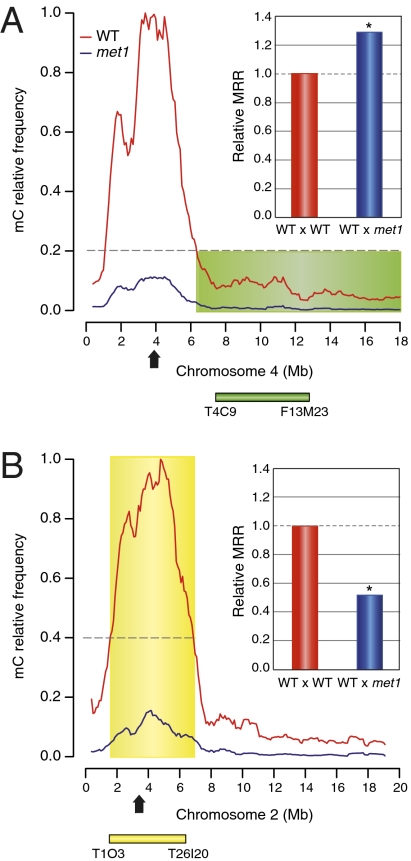
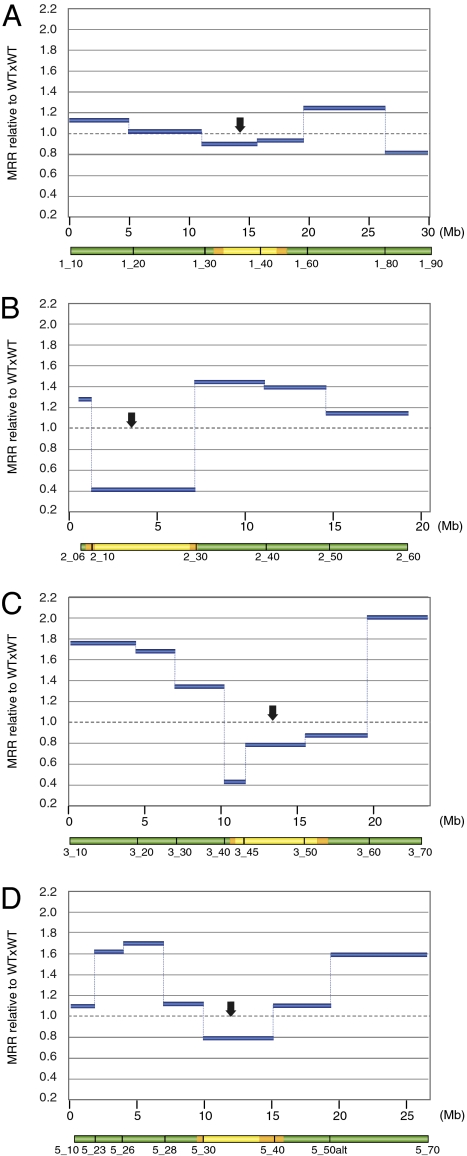
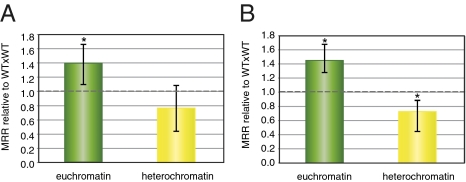
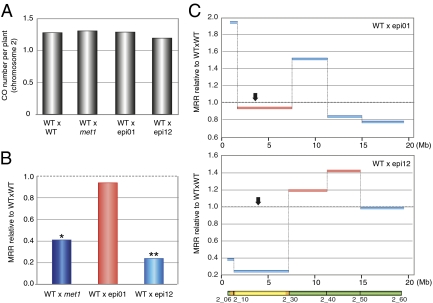
During sexual reproduction, one-half of the genetic material is deposited in gametes, and a complete set of chromosomes is restored upon fertilization. Reduction of the genetic information before gametogenesis occurs in meiosis, when cross-overs (COs) between homologous chromosomes secure an exchange of their genetic information. COs are not evenly distributed along chromosomes and are suppressed in chromosomal regions encompassing compact, hypermethylated centromeric and pericentromeric DNA. Therefore, it was postulated that DNA hypermethylation is inhibitory to COs. Here, when analyzing meiotic recombination in mutant plants with hypomethylated DNA, we observed unexpected and counterintuitive effects of DNA methylation losses on CO distribution. Recombination was further promoted in the hypomethylated chromosome arms while it was inhibited in heterochromatic regions encompassing pericentromeric DNA. Importantly, the total number of COs was not affected, implying that loss of DNA methylation led to a global redistribution of COs along chromosomes. To determine by which mechanisms altered levels of DNA methylation influence recombination--whether directly in cis or indirectly in trans by changing expression of genes encoding recombination components--we analyzed CO distribution in wild-type lines with randomly scattered and well-mapped hypomethylated chromosomal segments. The results of these experiments, supported by expression profiling data, suggest that DNA methylation affects meiotic recombination in cis. Because DNA methylation exhibits significant variation even within a single species, our results imply that it may influence the evolution of plant genomes through the control of meiotic recombination.


Conflict of interest statement

The authors declare no conflict of interest.

Figures

Fig. 1.
Fig. 1.
The met1 mutation effect on MRRs depends on chromatin states. The MRR in plants derived from the cross between WT (Landsberg accession) and met1 mutant (Columbia accession) was analyzed at two intervals with contrasted DNA methylation levels. The methylcytosine (mC) density plots were obtained from bisulfite sequencing data (3, 4) by using a 100,000-base sliding window with 10-base steps. The WT Col-0 (red curve) and met1-3 (blue curve, met1) mC densities are relative to the highest methylation level detected in WT Col-0 plants. Based on the relative DNA methylation in WT plants, we defined euchromatic and heterochromatic intervals as chromosomal regions having <20% (green shading) or >40% (yellow shading) relative mC levels in WT, respectively. F2 plants originating from the cross between WT and WT (WTxWT) and WT and met1 (WTxmet1) were genotyped for INDEL markers at two intervals as shown below the mC density graphs (green box, euchromatic interval; yellow box, heterochromatic interval). MRR was calculated from 192 F2 plants originating from two different F1 plants for both WTxWT and WTxmet1 populations. WTxmet1 MRR is compared with WTxWT MRR set at 1 (red bar, WTxWT; blue bar, WTxmet1). Arrow, centromere. (A) MRR is higher in WTxmet1 at the euchromatic interval located on the long arm of chromosome 4 (green bar). *P < 0.02, t test. (B) MRR is lower in WTxmet1 at the heterochromatic interval spanning the centromeric region on chromosome 2 (yellow bar). *P < 0.05, t test.
Fig. 2.
Fig. 2.
Contrasted effect of the met1 mutation on MRR along Arabidopsis chromosomes. F2 plants originating from the cross between WT and met1 (WTxmet1 population) were genotyped by using KASP markers. Intervals defined by these markers are represented below the graphs and color-coded to indicate their relative mC level in WT (green box, 0–20% mC; orange box, 20–40% mC; yellow box, >40% mC; see Fig. S1 for details). Calculated MRR was normalized to the data obtained with the WTxWT control cross. Relative MRR (WTxmet1 relative to WTxWT) is represented along Arabidopsis chromosomes (arrow, centromere; Mb, coordinates in Mb; dotted lines, WTxWT MRR set at 1). (A) Chromosome 1. (B) Chromosome 2. (C) Chromosome 3. (D) Chromosome 5.
Fig. 3.
Fig. 3.
MRR in euchromatic vs. heterochromatic intervals. MRR for the WTxmet1 population is shown relative to the data obtained with the control cross (WTxWT). (A) MRR for intervals located on chromosomes 1, 2, 3, and 5 according to their euchromatic (green bar) or heterochromatic (yellow bar) content. (B) MRR for intervals located on chromosomes 2 and 3. *P = 0.01, χ2.
Fig. 4.
Fig. 4.
The combination of DNA hypomethylation and inbreeding affects MRR in epiRILs. F2 plants originating from the cross between WT and epi01 (WTxepi01) and WT and epi12 (WTxepi12) were genotyped for SNPs by using KASP markers. (A) Total number of COs per plant for chromosome 2 for the four F2 populations. (B) MRR at the centromeric region of chromosome 2. MRR obtained from F2 plants originating from two different F1 plants is presented relative to WTxWT MRR and is compared with the data obtained from the cross between WT and met1 mutant (WTxmet1, blue bar). The bars are color-coded to indicate the global methylation status of the parental epiRIL at the analyzed heterochromatic intervals (light blue, met1-like methylation; light red, WT-like methylation). Dotted lines mark the WTxWT MRR set at 1. *P < 0.001; **P < 0.0001 (ANOVA). (C) Relative MRR (WTxepi01 relative to WTxWT, Upper; WTxepi12 relative to WTxWT, Lower) is represented along chromosome 2 (arrow, centromere; Mb, coordinates in Mb; gray dotted lines, WTxWT MRR set at 1).

References

    1. Yanowitz J. Meiosis: Making a break for it. Curr Opin Cell Biol. 2010;22:744–751. - PMC - PubMed
    1. Ronceret A, Sheehan M, Pawlowski W. Chromosome dynamics in meiosis. In: Verma DPS, Hong Z, editors. Cell Division Control in Plants. Heidelberg: Springer; 2007. pp. 103–124.
    1. Lister R, et al. Highly integrated single-base resolution maps of the epigenome in Arabidopsis. Cell. 2008;133:523–536. - PMC - PubMed
    1. Cokus SJ, et al. Shotgun bisulphite sequencing of the Arabidopsis genome reveals DNA methylation patterning. Nature. 2008;452:215–219. - PMC - PubMed
    1. Eichten SR, et al. Heritable epigenetic variation among maize inbreds. PLoS Genet. 2011;7:e1002372. - PMC - PubMed

Publication types

Associated data