. 2014;17(1):2-10.
doi: 10.1080/10255842.2011.653784. Epub 2012 Mar 28.

An experimental and computational analysis of primary cilia deflection under fluid flow

Affiliations

An experimental and computational analysis of primary cilia deflection under fluid flow

Matthew E Downs et al. Comput Methods Biomech Biomed Engin. 2014.

Erratum in

  • Comput Methods Biomech Biomed Engin. 2014;17(4):459

Abstract

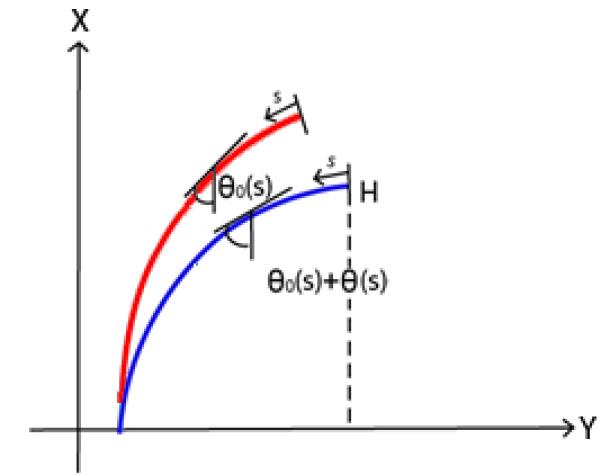
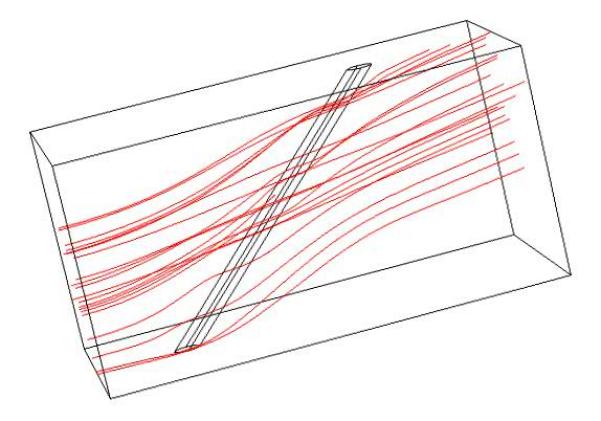
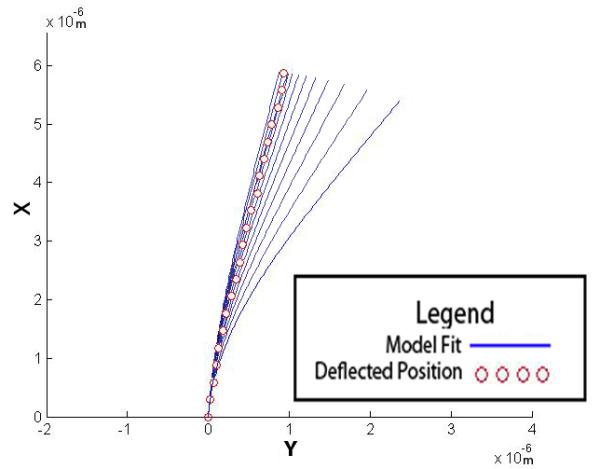
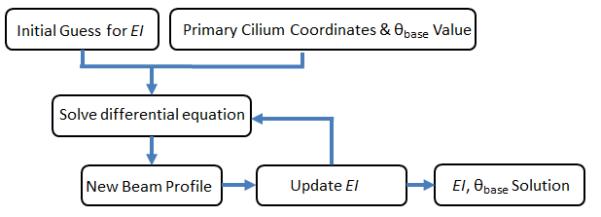
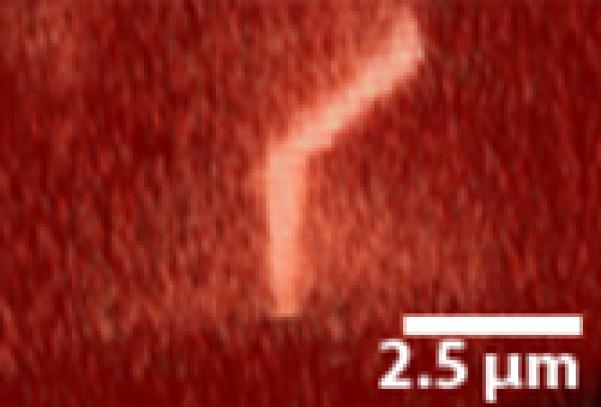
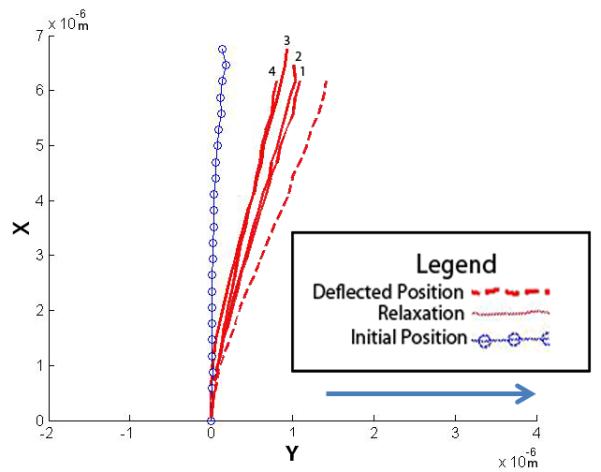
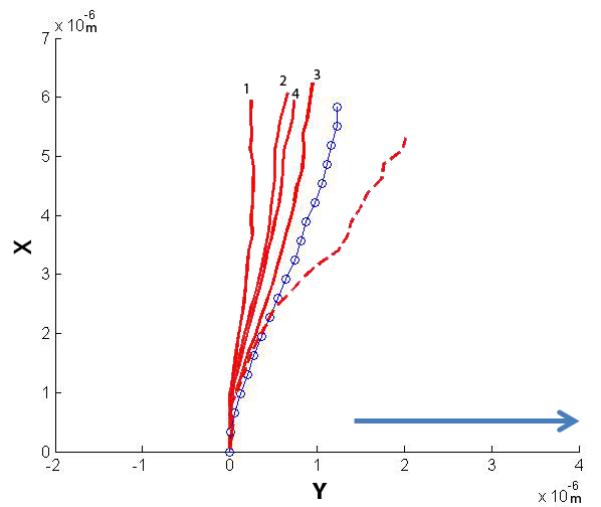
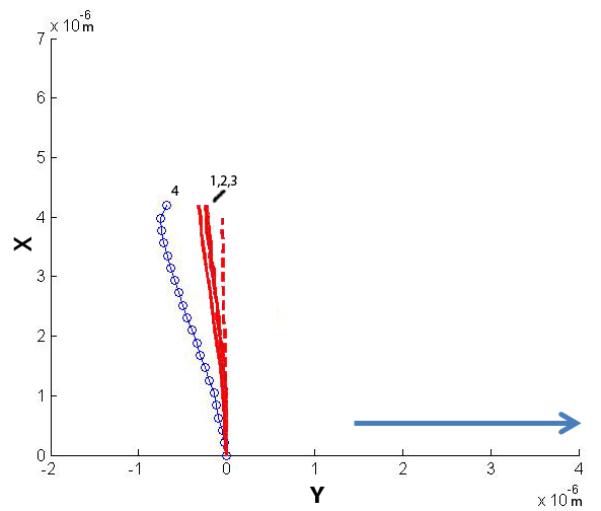
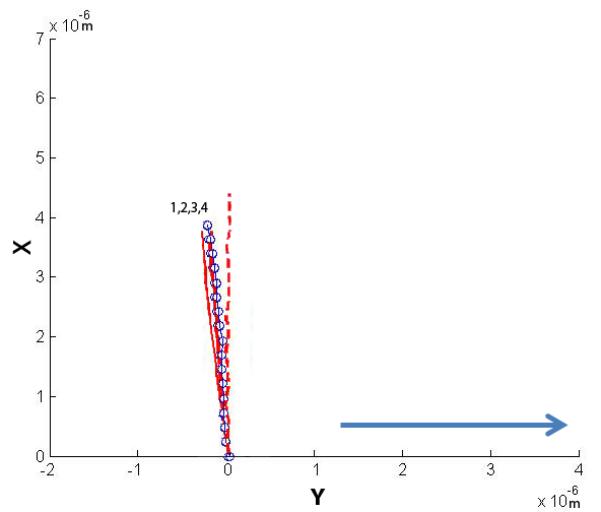
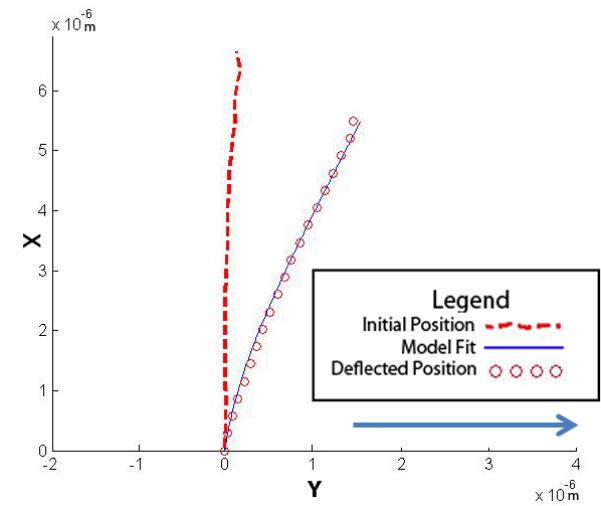
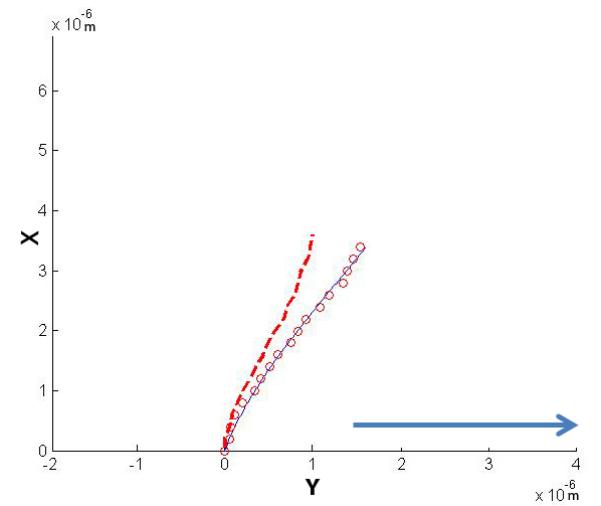
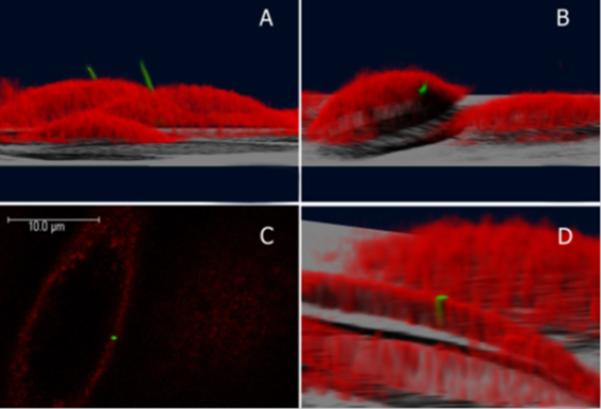
In this study we have developed a novel model of the deflection of primary cilia experiencing fluid flow accounting for phenomena not previously considered. Specifically, we developed a large rotation formulation that accounts for rotation at the base of the cilium, the initial shape of the cilium and fluid drag at high deflection angles. We utilised this model to analyse full 3D data-sets of primary cilia deflecting under fluid flow acquired with high-speed confocal microscopy. We found a wide variety of previously unreported bending shapes and behaviours. We also analysed post-flow relaxation patterns. Results from our combined experimental and theoretical approach suggest that the average flexural rigidity of primary cilia might be higher than previously reported (Schwartz et al. 1997, Am J Physiol. 272(1 Pt 2):F132-F138). In addition our findings indicate that the mechanics of primary cilia are richly varied and mechanisms may exist to alter their mechanical behaviour.


Figures

Figure 1
Figure 1
Parameter system used with the model. Here H is the vertical distance between the tip and the base, θ is the angle the cilium forms with respect to the vertical, and s is zero at the free end and L at the fixed end. The red line is the non-stressed position while the blue line is the deflected position. Here, θo(s) is the angle of the non-stressed cilium and θ(s) is angle of the cilium under fluid flow.
Figure 2
Figure 2
Typical fluid streamlines predicted from the Comsol finite element model. The model was re-solved for various cylinder angles and total drag force calculated.
Figure 3
Figure 3
Estimating EI and θbase from the observed deflection. (A) Shows how the different values of EI affect the solution of the model. (B) A flowchart depicting the fitting algorithm.
Figure 3
Figure 3
Estimating EI and θbase from the observed deflection. (A) Shows how the different values of EI affect the solution of the model. (B) A flowchart depicting the fitting algorithm.
Figure 4
Figure 4
A primary cilium deflecting under increasing fluid flow. Direction of flow is from left to right. (A) Non-stressed conditions. (B) 500ul/min flow
Figure 4
Figure 4
A primary cilium deflecting under increasing fluid flow. Direction of flow is from left to right. (A) Non-stressed conditions. (B) 500ul/min flow
Figure 5
Figure 5
An example of a cilium exhibiting very little bending of the axoneme. Rather, deflection is caused by rotation of the base. (A) No-flow conditions (B) Flow.
Figure 5
Figure 5
An example of a cilium exhibiting very little bending of the axoneme. Rather, deflection is caused by rotation of the base. (A) No-flow conditions (B) Flow.
Figure 6
Figure 6
A “kinked” deflection profile. The primary cilium exhibits a unique non-linear bending profile with fluid flow.
Figure 7
Figure 7
Four cilia were exposed to higher flow rates and their post-flow relaxation imaged. The plots show the initial non-stressed position, the maximum deflected position and the relaxation positions. The four relaxation positions are noted 1-4, with 1 being the first time point taken at time = 0 min, and 4 being the last at time = 2 min (30 second interval between each point). The arrow indicates the direction of fluid flow.
Figure 7
Figure 7
Four cilia were exposed to higher flow rates and their post-flow relaxation imaged. The plots show the initial non-stressed position, the maximum deflected position and the relaxation positions. The four relaxation positions are noted 1-4, with 1 being the first time point taken at time = 0 min, and 4 being the last at time = 2 min (30 second interval between each point). The arrow indicates the direction of fluid flow.
Figure 8
Figure 8
Representative numerical solutions for y and x from the parameter estimation of single primary cilium subjected to fluid flow at 500ul/min with (A) a vertical initial configuration and (B) a non-vertical initial configuration. The solution to the model fit the confocal images of a primary cilium deflection. The direction of fluid flow is indicated by the arrow.
Figure 8
Figure 8
Representative numerical solutions for y and x from the parameter estimation of single primary cilium subjected to fluid flow at 500ul/min with (A) a vertical initial configuration and (B) a non-vertical initial configuration. The solution to the model fit the confocal images of a primary cilium deflection. The direction of fluid flow is indicated by the arrow.
Figure 9
Figure 9
The position of the primary cilium on a cell. The cilium is green and the cell membrane is red. (A), (B), and (D) are 3D reconstructions of the cell. (A) The primary cilium projecting from the top of the cell into the extracellular space. (B) Sometimes the primary cilium is embedded within the cell membrane. (C) Confocal image slice from (B) of the cilium surrounded by the cell membrane. (D) A 3D reconstruction of (B) where the cell was cut at a selected height to visualize the embedded cilium.

References

    1. Alieva IB, Nadezhdina ES, Vaisberg EA, Vorobjev IA. Microtubule and intermediate filament patterns around the centrosome in interphase cells. The Centrosome. 1992;15:103–129.
    1. Anderson CT, Castillo AB, Brugmann SA, Helms JA, Jacobs CR, Stearns T. Primary cilia: cellular sensors for the skeleton. Anat Rec (Hoboken) 2008;291(9):1074–1078. - PMC - PubMed
    1. Barbac RG, Smit TH, Cowin SC, Van Loon JJWA, Nieuwstadt FTM, Heethar R, Klien-Nulend J. Dynamic Shear Stress in Paralell-Plate Flow Chambers. J Biomech. 2005;38(1):159–167. - PubMed
    1. Besschetnova TY, Kolpakova-Hart E, Guan Y, Zhou J, Olsen BR, Shah JV. Identification of signaling pathways regulating primary cilium length and flow-mediated adaptation. Curr Biol. 2010;20(2):182–187. - PMC - PubMed
    1. Davenport JR, Yoder BK. An incredible decade for the primary cilium: a look at a once-forgotten organell. Am J Physiol Renal Physiol. 2005;289(6):F1159–69. - PubMed

Publication types

LinkOut - more resources