Allosteric activation of the phosphoinositide phosphatase Sac1 by anionic phospholipids
- PMID: 22452743
- PMCID: PMC3329130
- DOI: 10.1021/bi300086c
Allosteric activation of the phosphoinositide phosphatase Sac1 by anionic phospholipids
Abstract
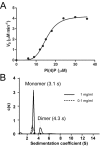
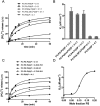
Sac family phosphoinositide phosphatases comprise an evolutionarily conserved family of enzymes in eukaryotes. Our recently determined crystal structure of the Sac phosphatase domain of yeast Sac1, the founding member of the Sac family proteins, revealed a unique conformation of the catalytic P-loop and a large positively charged groove at the catalytic site. We now report a unique mechanism for the regulation of its phosphatase activity. Sac1 is an allosteric enzyme that can be activated by its product phosphatidylinositol or anionic phospholipid phosphatidylserine. The activation of Sac1 may involve conformational changes of the catalytic P-loop induced by direct binding with the regulatory anionic phospholipids in the large cationic catalytic groove. These findings highlight the fact that lipid composition of the substrate membrane plays an important role in the control of Sac1 function.
Figures


Similar articles
-
Crystal structure of the yeast Sac1: implications for its phosphoinositide phosphatase function.EMBO J. 2010 May 5;29(9):1489-98. doi: 10.1038/emboj.2010.57. Epub 2010 Apr 13. EMBO J. 2010. PMID: 20389282 Free PMC article.
-
Involvement of Sac1 phosphoinositide phosphatase in the metabolism of phosphatidylserine in the yeast Saccharomyces cerevisiae.Yeast. 2014 Apr;31(4):145-58. doi: 10.1002/yea.3004. Epub 2014 Mar 13. Yeast. 2014. PMID: 24578286
-
Sac1, a lipid phosphatase at the interface of vesicular and nonvesicular transport.Traffic. 2018 May;19(5):301-318. doi: 10.1111/tra.12554. Epub 2018 Mar 25. Traffic. 2018. PMID: 29411923 Review.
-
Co-opted Cellular Sac1 Lipid Phosphatase and PI(4)P Phosphoinositide Are Key Host Factors during the Biogenesis of the Tombusvirus Replication Compartment.J Virol. 2020 Jun 1;94(12):e01979-19. doi: 10.1128/JVI.01979-19. Print 2020 Jun 1. J Virol. 2020. PMID: 32269127 Free PMC article.
-
The structure and function of catalytic domains within inositol polyphosphate 5-phosphatases.IUBMB Life. 2002 Jan;53(1):15-23. doi: 10.1080/15216540210814. IUBMB Life. 2002. PMID: 12018403 Review.
Cited by
-
Lenz-Majewski mutations in PTDSS1 affect phosphatidylinositol 4-phosphate metabolism at ER-PM and ER-Golgi junctions.Proc Natl Acad Sci U S A. 2016 Apr 19;113(16):4314-9. doi: 10.1073/pnas.1525719113. Epub 2016 Apr 4. Proc Natl Acad Sci U S A. 2016. PMID: 27044099 Free PMC article.
-
Roles for a lipid phosphatase in the activation of its opposing lipid kinase.Mol Biol Cell. 2020 Aug 1;31(17):1835-1845. doi: 10.1091/mbc.E18-09-0556. Epub 2020 Jun 17. Mol Biol Cell. 2020. PMID: 32583743 Free PMC article.
-
Lipid synthesis and transport are coupled to regulate membrane lipid dynamics in the endoplasmic reticulum.Biochim Biophys Acta Mol Cell Biol Lipids. 2020 Jan;1865(1):158461. doi: 10.1016/j.bbalip.2019.05.005. Epub 2019 May 18. Biochim Biophys Acta Mol Cell Biol Lipids. 2020. PMID: 31108203 Free PMC article. Review.
-
Shared and more specific genetic determinants and pathways underlying yeast tolerance to acetic, butyric, and octanoic acids.Microb Cell Fact. 2024 Feb 29;23(1):71. doi: 10.1186/s12934-024-02309-0. Microb Cell Fact. 2024. PMID: 38419072 Free PMC article.
-
The structure of phosphoinositide phosphatases: Insights into substrate specificity and catalysis.Biochim Biophys Acta. 2015 Jun;1851(6):698-710. doi: 10.1016/j.bbalip.2014.09.015. Epub 2014 Sep 28. Biochim Biophys Acta. 2015. PMID: 25264170 Free PMC article. Review.
References
-
- Odorizzi G.; Babst M.; Emr S. D. (2000) Phosphoinositide signaling and the regulation of membrane trafficking in yeast. Trends Biochem. Sci. 25, 229–235. - PubMed
-
- De Matteis M. A.; Godi A. (2004) PI-loting membrane traffic. Nat. Cell Biol. 6, 487–492. - PubMed
-
- Di Paolo G.; De Camilli P. (2006) Phosphoinositids in cell regulation and membrane dynamics. Nature 443, 651–657. - PubMed
Publication types
MeSH terms
Substances
Grants and funding
LinkOut - more resources
Full Text Sources
Molecular Biology Databases

