. 2012 May 17;119(20):4686-97.
doi: 10.1182/blood-2011-09-377846. Epub 2012 Mar 27.

Multiple myeloma exhibits novel dependence on GLUT4, GLUT8, and GLUT11: implications for glucose transporter-directed therapy

Affiliations

Multiple myeloma exhibits novel dependence on GLUT4, GLUT8, and GLUT11: implications for glucose transporter-directed therapy

Samuel K McBrayer et al. Blood. .

Abstract

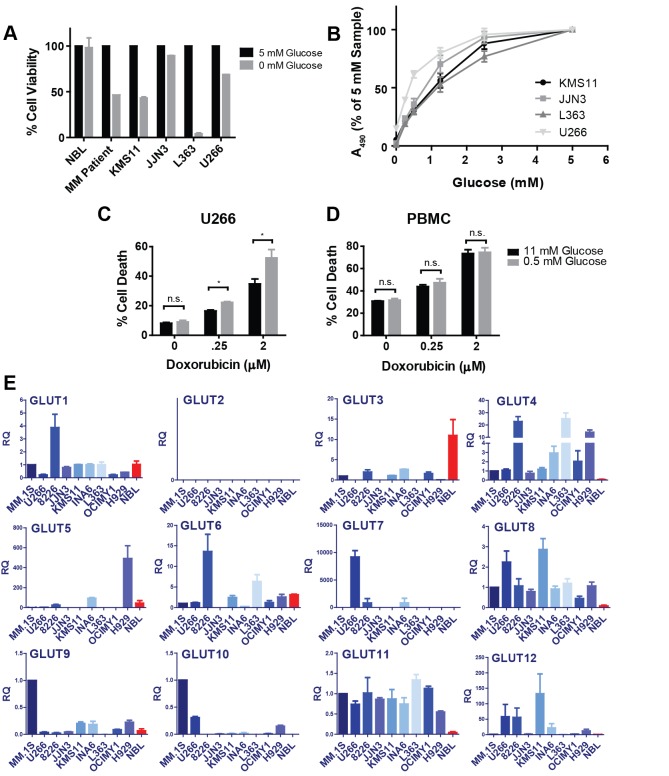
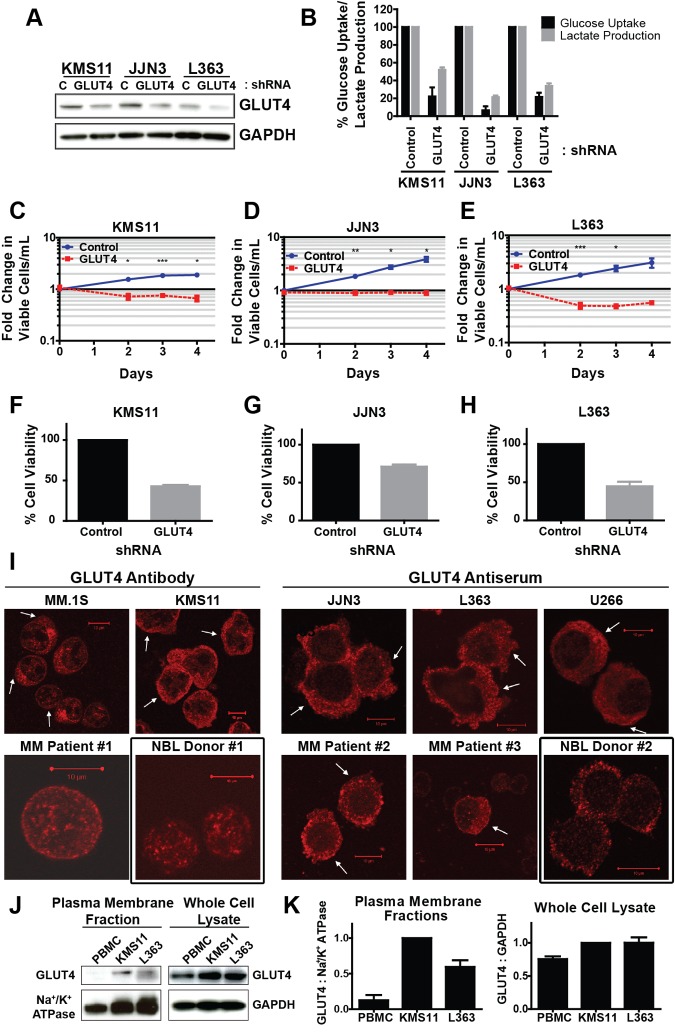
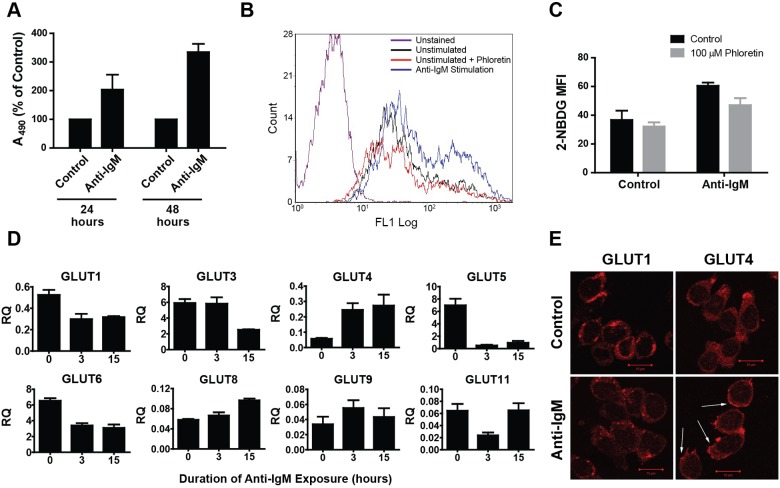
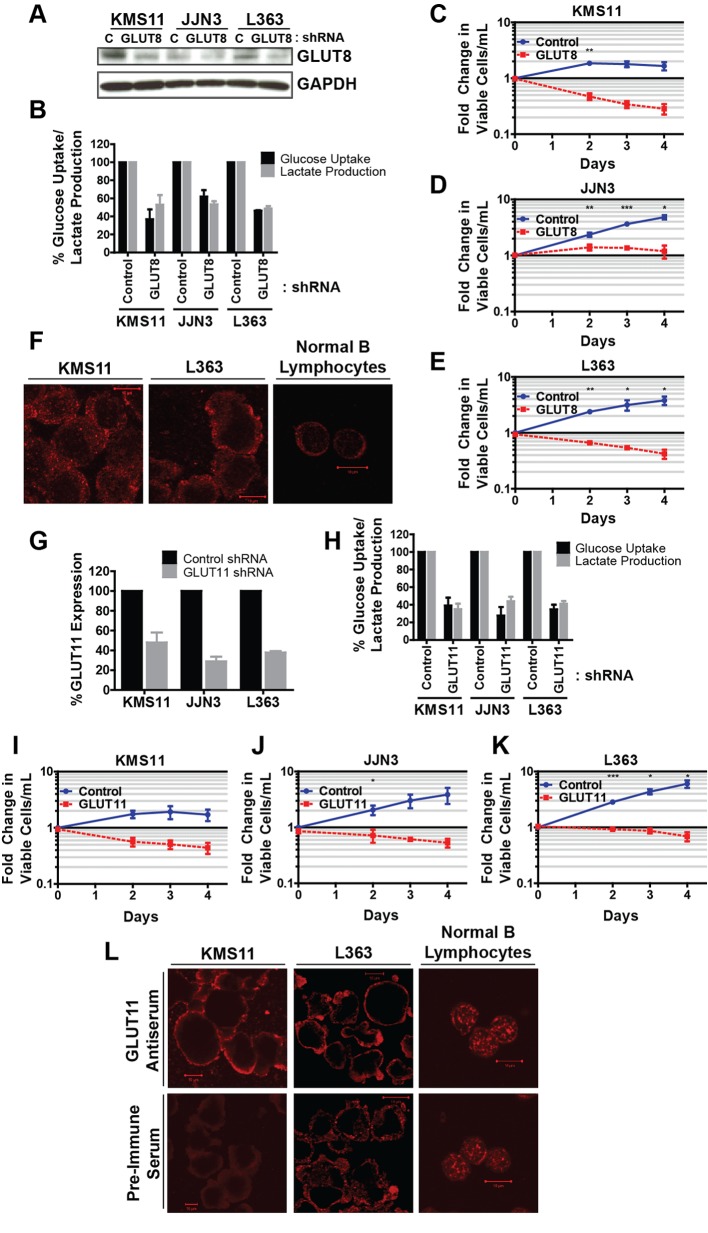
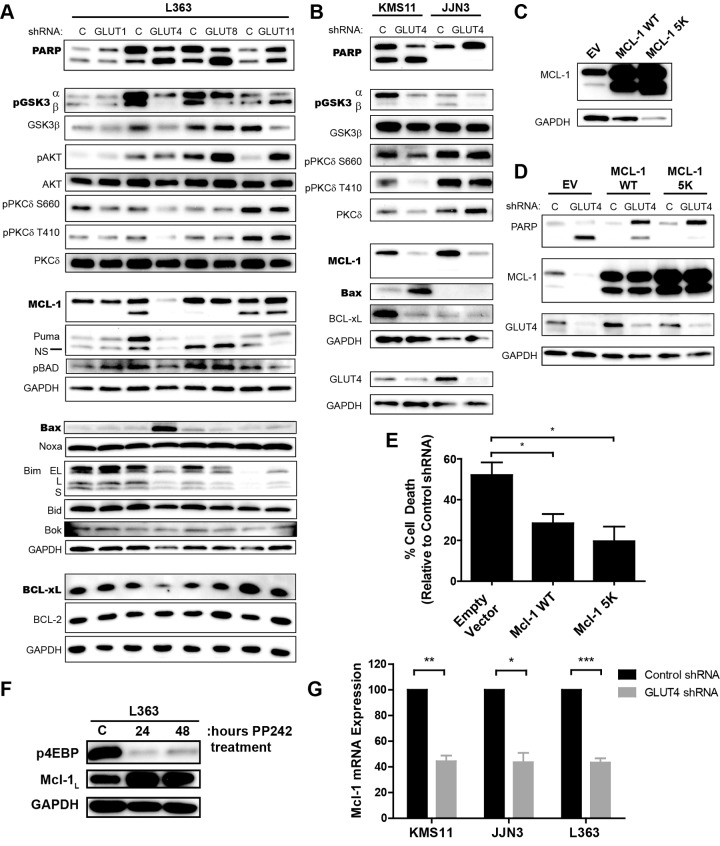
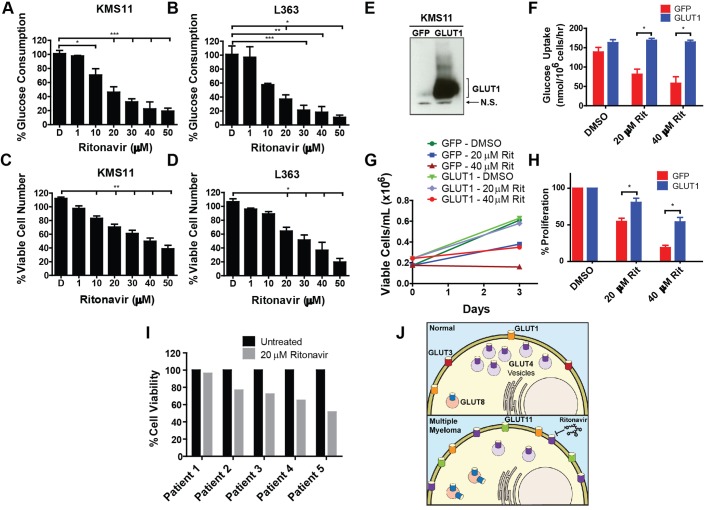
Multiple myeloma is one of numerous malignancies characterized by increased glucose consumption, a phenomenon with significant prognostic implications in this disease. Few studies have focused on elucidating the molecular underpinnings of glucose transporter (GLUT) activation in cancer, knowledge that could facilitate identification of promising therapeutic targets. To address this issue, we performed gene expression profiling studies involving myeloma cell lines and primary cells as well as normal lymphocytes to uncover deregulated GLUT family members in myeloma. Our data demonstrate that myeloma cells exhibit reliance on constitutively cell surface-localized GLUT4 for basal glucose consumption, maintenance of Mcl-1 expression, growth, and survival. We also establish that the activities of the enigmatic transporters GLUT8 and GLUT11 are required for proliferation and viability in myeloma, albeit because of functionalities probably distinct from whole-cell glucose supply. As proof of principle regarding the therapeutic potential of GLUT-targeted compounds, we include evidence of the antimyeloma effects elicited against both cell lines and primary cells by the FDA-approved HIV protease inhibitor ritonavir, which exerts a selective off-target inhibitory effect on GLUT4. Our work reveals critical roles for novel GLUT family members and highlights a therapeutic strategy entailing selective GLUT inhibition to specifically target aberrant glucose metabolism in cancer.


Figures

Figure 1
Figure 1
Myeloma cells exhibit glucose dependence and overexpression of GLUT4, GLUT8, and GLUT11 mRNAs relative to NBLs. (A) Primary myeloma cells, NBLs, and 4 MM cell lines were cultured in medium containing 0 or 5mM glucose for 48 (NBL, MM cell lines) or 72 (MM patient) hours. Cell viability was determined by flow cytometric analysis of annexin V/DAPI staining and normalized to 5mM samples. Data are mean ± SEM (n = 2 for MM cell lines and NBL, n = 1 for MM patient sample). (B) MM cell lines were cultured in various glucose concentrations for 72 hours. Viable cell quantities were determined by MTS assay (represented by absorbance at 490 nm) and normalized to 5mM samples. U266 cells (C) and normal PBMCs (D) were cultured in 11 or 0.5mM glucose-containing medium for 48 hours in the presence of the indicated concentrations of doxorubicin. Cell death was determined by DAPI staining. (E) Expression of GLUTs 1 to 12 was determined in 9 myeloma cell lines and NBLs (red bars) by quantitative real-time RT-PCR. Relative quantification (RQ) is displayed and normalized to the MM.1S cell line. For GLUT4, GLUT8, and GLUT11, comparisons between each MM cell line and NBLs exhibit 1-tailed P values less than .05, with the exception of GLUT4 expression in the OCIMY1 cell line. (B-E) Data are mean ± SEM (n ≥ 3). *P < .05. **P < .01. ***P < .005.
Figure 2
Figure 2
Expression of constitutively plasma membrane-localized GLUT4 is necessary for glucose consumption, lactate production, growth, and viability of myeloma cells. (A) Cells were transduced with control (C), nontargeted shRNA or GLUT4-targeted shRNA and incubated 3 (L363) or 4 (JJN3, KMS11) days before protein extraction, and analysis of GLUT4 protein expression was performed. Representative blot is shown. (B) Cells from panel A were cultured in 5mM glucose-containing medium for 5 hours. Glucose consumption rates and lactate production rates were determined and normalized to control shRNA-expressing cells. (C-E) Cells from panel A were analyzed for viability and proliferation. Viable cell densities are expressed as fold change relative to the day 0 reading of control shRNA-expressing cells. (F-H) Cells from panels C through E were evaluated for viability via trypan blue exclusion. Values are normalized to control shRNA-expressing cells. (I) GLUT4 localization in CD138+ primary myeloma cells, myeloma cell lines, and NBLs was assessed via confocal immunofluorescence microscopy. Arrows indicate regions of cell surface GLUT4 immunoreactivity. Black boxes represent normal controls. Representative images are shown (n = 1 for primary samples). (J) KMS11 cells, L363 cells, and normal PBMCs were lysed for extraction of plasma membrane-associated proteins or total cellular protein content. GLUT4 immunoblot analysis was performed on the resulting fractions. Na+/K+ ATPase and GAPDH serve as loading controls. (K) Densitometric quantification of band intensities in panel G are displayed, normalized first to corresponding loading controls and subsequently to KMS11 cells. (B-H,K) Data are mean ± SEM. With exception noted in panel I, n ≥ 3 for data in panels A through K. *P < .05. **P < .01. ***P < .005.
Figure 3
Figure 3
Anti-IgM–mediated B lymphocyte activation is associated with an increase in GLUT4 expression and cell surface localization. (A) NBLs isolated from whole blood were incubated with or without anti–human IgM F(ab′)2 for the indicated durations, and viable cell quantities were determined by MTS assay (represented by absorbance at 490 nm) and normalized to control cells. Data are mean ± SEM (n ≥ 2). (B) NBLs incubated with or without anti-IgM for 15 hours and pretreated (or not) with 100μM phloretin before evaluation of glucose consumption rates via 2-NBDG uptake assay and flow cytometric quantification of fluorescence intensity. A representative histogram is shown. (C) Quantification of data represented in panel B is shown. Median fluorescence intensity values were derived from 3 independent experiments. Data are mean ± SEM (n = 3). (D) Expression of GLUTs 1 to 12 was determined in a time-course analysis of B lymphocytes incubated with anti-IgM for 0, 3, and 15 hours by quantitative real-time RT-PCR. Relative quantification (RQ) is displayed and normalized to the MM.1S cell line for reference to expression levels in myeloma. GLUTs 2, 7, 10, and 12 were undetected. Data are mean ± SEM (n ≥ 2). (E) B lymphocytes were incubated with or without anti-IgM for 15 hours before analysis of GLUT1 and GLUT4 intracellular distribution via confocal immunofluorescence microscopy. Arrows indicate regions of cell surface GLUT4 immunoreactivity. Representative images are shown (n = 4).
Figure 4
Figure 4
RNAi-mediated suppression of GLUT8 or GLUT11 compromises the viability of myeloma cell lines. (A) Cells were transduced with the indicated shRNAs and incubated 2 days before protein extraction. Representative blot is shown. (B) Cells from panel A were cultured in 5mM glucose-containing medium for 5 hours. Glucose consumption rates and lactate production rates were determined and normalized to control shRNA-expressing cells. (C-E) Cells from panel A were analyzed for viability and proliferation. Viable cell densities are expressed as fold change relative to the day 0 reading of control shRNA-expressing cells. (F) GLUT8 subcellular localization in KMS11 cells, L363 cells, and NBLs was assessed via confocal immunofluorescence microscopy. Representative images are shown. (G) Cells were transduced with the indicated shRNAs and incubated 3 days before RNA extraction. (H) Cells from panel G were cultured in 5mM glucose-containing medium for 5 hours. Glucose consumption rates and lactate production rates were determined and normalized to control shRNA-expressing cells. (I-K) Cells from panel G were analyzed for viability and proliferation. Viable cell densities are expressed as fold change relative to the day 0 reading of control shRNA-expressing cells. (L) GLUT11 subcellular localization in KMS11 cells, L363 cells, and NBLs was assessed via confocal immunofluorescence microscopy. Background, nonspecific staining with preimmune serum is included as a control. Representative images are shown. (B-E,G-K) Data are mean ± SEM. (A-L) n ≥ 3. *P < .05. **P < .01. ***P < .005.
Figure 5
Figure 5
GLUT-specific modulation of signal transducers and apoptosis effectors: cytotoxicity of GLUT4 silencing is mediated by Mcl-1 suppression. (A) L363 cells were transduced with the indicated shRNAs, and cell lysates were prepared. Representative blots are shown. (B) KMS11 and JJN3 cells were transduced with control (C) or GLUT4-targeted shRNA and incubated for 4 days before lysate preparation. Representative blots are shown. (C) L363 cells were transduced with an empty vector control (EV), WT MCL1 (Mcl-1 WT), or ubiquitination-resistant MCL1 mutant (Mcl-1 5K). Stable cell lines were generated, and Mcl-1 expression was assessed by immunoblot analysis. Representative blot is shown. (D) L363 stable cell lines from panel C were transduced with control- or GLUT4-targeted shRNA and incubated for 3 days before immunoblot analysis of GLUT4, Mcl-1, and PARP. Representative blot is shown. (E) Cells from panel D were subjected to flow cytometric viability analysis via annexin V/DAPI staining. Data are normalized to control shRNA-expressing cells within each cell line. Data in panel E are mean ± SEM. (F) L363 cells were treated with DMSO (C) or 1μM PP242, the active site kinase inhibitor of mTOR, for the indicated lengths of time before protein extraction. Immunoblot analysis of phospho-4EBP1 and Mcl-1 levels is shown. GAPDH serves as a loading control. Representative blot is shown (n = 2). (G) Cells were transduced with control or GLUT4-targeted shRNA and incubated 4 days before RNA extraction, and real-time RT-PCR analysis of Mcl-1 mRNA expression was performed. Relative quantities are shown and normalized to control shRNA-expressing cells. (G) Data are mean ± SEM. (A-E,G) n ≥ 3. *P < .05. **P < .01. ***P < .005.
Figure 6
Figure 6
GLUT4-specific glucose transport inhibition elicited by the HIV therapeutic ritonavir suppresses myeloma growth and viability. (A) KMS11 and (B) L363 cells were plated in 5mM glucose medium with ritonavir or DMSO (D) for 17 hours. Glucose consumption rates are normalized to untreated cells (not shown). (C) KMS11 and (D) L363 cells were treated with ritonavir or DMSO for 72 hours. Relative viable cell numbers were determined by MTS assay and normalized to untreated cells (not shown). (E) Stable KMS11 cell lines were generated expressing empty vector or GLUT1 and GLUT1 levels were assessed by immunoblot analysis. Representative blot is shown. N.S. indicates nonspecific band. (F) Stable cell lines from panel E were treated with DMSO or ritonavir (Rit) for 5 hours, and glucose consumption was assessed. (G) Cell proliferation was measured in the stable cell lines described in panel E treated with ritonavir (Rit) or DMSO for 72 hours. A representative experiment is shown. (H) Cell proliferation rates from multiple experiments represented by panel G are normalized to DMSO-treated cells. (I) Primary myeloma cells were treated with DMSO or ritonavir for 72 hours before annexin V/DAPI staining. Values are normalized to DMSO-treated samples (n = 1 for each patient sample). (J) Diagram highlights alterations in glucose transporter regulation between NBLs/plasma cells (top) and MM cells (bottom). (A-D,F,H) Data are mean ± SEM. (A-H) n ≥ 3. *P < .05. **P < .01. ***P < .005.

References

    1. Richardson PG, Schlossman R, Hideshima T, Anderson KC. New treatments for multiple myeloma. Oncology (Williston Park) 2005;19(14):1781–1792. discussion 1792,1795-1787. - PubMed
    1. Munshi N. Plasma cell disorders: an historical perspective. Hematology. 2008;1:297. - PubMed
    1. Zamagni E, Patriarca F, Nanni C, et al. Prognostic relevance of 18-F FDG PET/CT in newly diagnosed multiple myeloma patients treated with up-front autologous transplantation. Blood. 2011;118(23):5989–5995. - PubMed
    1. Bartel TB, Haessler J, Brown TL, et al. F18-fluorodeoxyglucose positron emission tomography in the context of other imaging techniques and prognostic factors in multiple myeloma. Blood. 2009;114(10):2068–2076. - PMC - PubMed
    1. Danial NN, Gramm CF, Scorrano L, et al. BAD and glucokinase reside in a mitochondrial complex that integrates glycolysis and apoptosis. Nature. 2003;424(6951):952–956. - PubMed

Publication types

MeSH terms