. 2012 Mar 28:10:62.
doi: 10.1186/1479-5876-10-62.

The Stanford Data Miner: a novel approach for integrating and exploring heterogeneous immunological data

Affiliations

The Stanford Data Miner: a novel approach for integrating and exploring heterogeneous immunological data

Janet C Siebert et al. J Transl Med. .

Abstract

Background: Systems-level approaches are increasingly common in both murine and human translational studies. These approaches employ multiple high information content assays. As a result, there is a need for tools to integrate heterogeneous types of laboratory and clinical/demographic data, and to allow the exploration of that data by aggregating and/or segregating results based on particular variables (e.g., mean cytokine levels by age and gender).

Methods: Here we describe the application of standard data warehousing tools to create a novel environment for user-driven upload, integration, and exploration of heterogeneous data. The system presented here currently supports flow cytometry and immunoassays performed in the Stanford Human Immune Monitoring Center, but could be applied more generally.

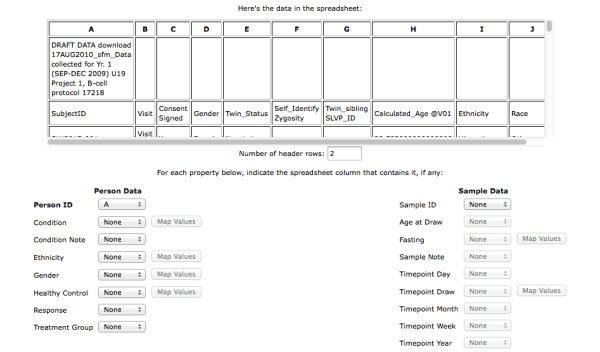
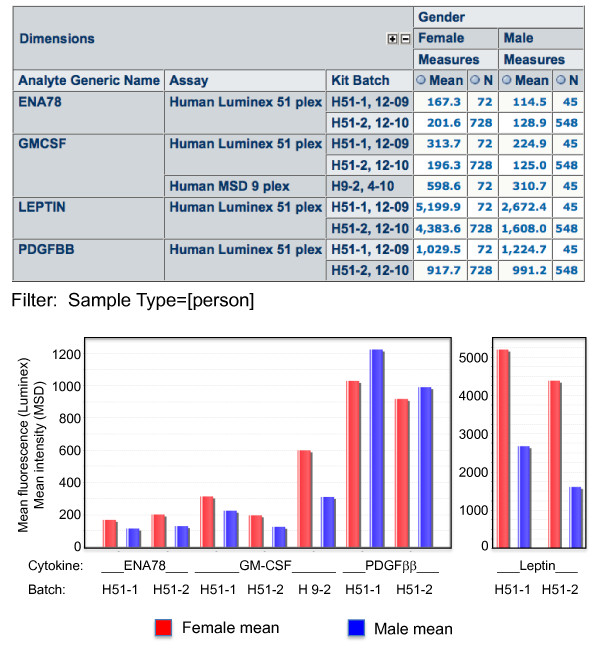
Results: Users upload assay results contained in platform-specific spreadsheets of a defined format, and clinical and demographic data in spreadsheets of flexible format. Users then map sample IDs to connect the assay results with the metadata. An OLAP (on-line analytical processing) data exploration interface allows filtering and display of various dimensions (e.g., Luminex analytes in rows, treatment group in columns, filtered on a particular study). Statistics such as mean, median, and N can be displayed. The views can be expanded or contracted to aggregate or segregate data at various levels. Individual-level data is accessible with a single click. The result is a user-driven system that permits data integration and exploration in a variety of settings. We show how the system can be used to find gender-specific differences in serum cytokine levels, and compare them across experiments and assay types.

Conclusions: We have used the tools and techniques of data warehousing, including open-source business intelligence software, to support investigator-driven data integration and mining of diverse immunological data.


Figures

Figure 1
Figure 1
Dimensional data model. An aliquot_fact, or single experimental data point, is associated in our dimensional model with the additional dimensions of person, sample, analyte, and data source. This schema provides a simple way to represent and associate heterogeneous translational data.
Figure 2
Figure 2
Upload Experiment Metadata page. A spreadsheet containing clinical and/or demographic "metadata" is uploaded and its contents displayed at the top of the page. In the lower half of the page, one can select which columns of the spreadsheet represent specific "Person" or "Sample" attributes. In this example, Person ID has been specified and the associated attributes are active. Sample ID has not been specified, so those attributes are inactive. Once an attribute has been mapped to a column, the associated Map Values button is activated (see Gender).
Figure 3
Figure 3
Map Valid Values page. The terms in certain columns (e.g. Condition, Ethnicity, and Gender) are mapped against a set of defined "valid values" for that attribute. In this way, a controlled vocabulary may be maintained even when terminology on incoming spreadsheets varies (e.g., "M" and "F" versus "male" and "female", "SLE" versus "lupus", etc.).
Figure 4
Figure 4
Map Batch Results to Sample page. Once sample metadata is uploaded, it needs to be "mapped" to laboratory data (batch results). This page allows the user to select a set of batch results (lower left), then map the aliquot IDs in those batch results to sample IDs from the uploaded metadata. Often, these don't fully match due to prefixes and suffixes that were added by the laboratory analysis software, so controls at the top of this page help to quickly remove such "artifacts". Once the IDs are made to match, the "Map Equals" button allows all matching IDs to be mapped at once. Alternately, individual IDs can be dragged and dropped from the Sample ID column to the Batch Results column to map them.
Figure 5
Figure 5
(A) Assay group by Sample Day. This OLAP cube displays aggregated data from each of three different assay types, and groups them by time point (day 0, 7, and 28). It is immediately apparent which assays were performed at which time points. (B) Identification of cytokines with gender bias. Expanding the Analytes dimension, and diplaying Gender in columns, we have selected those cytokines (4 of 51 analyzed) that show > 20% difference in mean expression between males and females. By also displaying Lot # in rows, we can see that the trends are preserved across two different lots of Luminex kits (H51-1 and H51-2), although absolute values vary by lot. For GM-CSF, the trend is also seen in a different type of assay (MSD 9-plex, shown as lot H9-2, 4/10). Other cytokines were not run in this assay type, so the cross-platform comparison can only be made for GM-CSF. Gender biases of the type shown here have been previously reported for ENA-78 [9], leptin [10,11], and PDGF [12], but to our knowledge not for GM-CSF. "Mean" indicates the mean MFI (median fluorescence intensity) of the indicated number of samples (N). Graphs of the data are exported from the native application to demonstrate the graphing functions of SDM.
Figure 6
Figure 6
OLAP integration of data from disparate types of assays and multiple projects, with demographic metadata. (A) Serum IL-6 as measured by MSD assay is compared to CD4+ pSTAT1 expression as measured by phosphoepitope flow cytometry (baseline and IL-6-stimulated pSTAT1 MFI, as well as fold-change (stim/unstim) are all shown). Data for three healthy cohorts (Projects) are displayed in columns, broken out by gender. (B) Graphing the mean serum IL-6 levels as a function of mean CD4+ pSTAT1 IL-6 stim/unstim ratios for males and females in each study shows higher serum IL-6 means in females, and correspondingly lower pSTAT1 induction in response to IL-6 stimulation in CD4+ T cells. A possible hypothesis is that chronically high IL-6 levels in females result in poorer pSTAT1 induction in response to IL-6.

References

    1. Querec TD, Akondy RS, Lee EK, Cao W, Nakaya HI, Teuwen D, Pirani A, Gernert K, Deng J, Marzolf B, Kennedy K, Wu H, Bennouna S, Oluoch H, Miller J, Vencio RZ, Mulligan M, Aderem A, Ahmed R, Pulendran B. Systems biology approach predicts immunogenicity of the yellow fever vaccine in humans. Nat Immunol. 2009;10:116–125. - PMC - PubMed
    1. Kimball R, Ross M, Thornthwaite W, Mundy J, Becker B. The Data Warehouse Lifecycle Toolkit. 2. Wiley; 2008.
    1. Siebert J. Integrated biomarker discovery: combining heterogeneous data. Bioanalysis. 2011;3:2369–2372. doi: 10.4155/bio.11.229. - DOI - PubMed
    1. Janetzki S, Britten CM, Kalos M, Levitsky HI, Maecker HT, Melief CJM, Old LJ, Romero P, Hoos A, Davis MM. "MIATA"-minimal information about T cell assays. Immunity. 2009;31:527–528. doi: 10.1016/j.immuni.2009.09.007. - DOI - PMC - PubMed
    1. Lee JA, Spidlen J, Boyce K, Cai J, Crosbie N, Dalphin M, Furlong J, Gasparetto M, Goldberg M, Goralczyk EM, Hyun B, Jansen K, Kollmann T, Kong M, Leif R, McWeeney S, Moloshok TD, Moore W, Nolan G, Nolan J, Nikolich-Zugich J, Parrish D, Purcell B, Qian Y, Selvaraj B, Smith C, Tchuvatkina O, Wertheimer A, Wilkinson P, Wilson C, Wood J, Zigon R, Scheuermann RH, Brinkman RR. MIFlowCyt: the minimum information about a Flow Cytometry Experiment. Cytometry A. 2008;73:926–930. - PMC - PubMed

Publication types