. 2012 Mar 27;4(3):24.
doi: 10.1186/gm323.

Epigenetic variability in cells of normal cytology is associated with the risk of future morphological transformation

Affiliations

Epigenetic variability in cells of normal cytology is associated with the risk of future morphological transformation

Andrew E Teschendorff et al. Genome Med. .

Abstract

Background: Recently, it has been proposed that epigenetic variation may contribute to the risk of complex genetic diseases like cancer. We aimed to demonstrate that epigenetic changes in normal cells, collected years in advance of the first signs of morphological transformation, can predict the risk of such transformation.

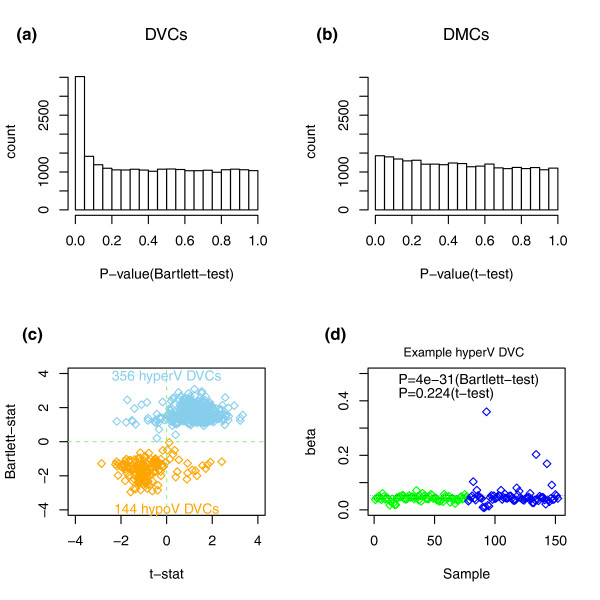
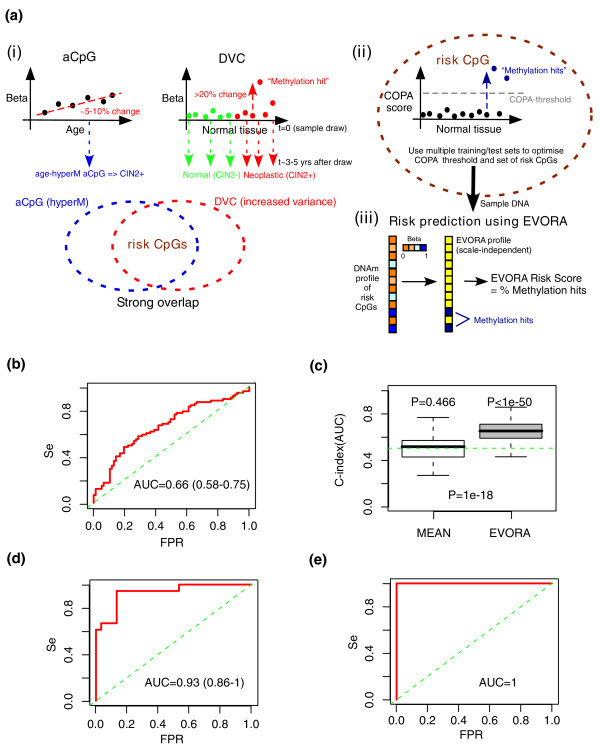
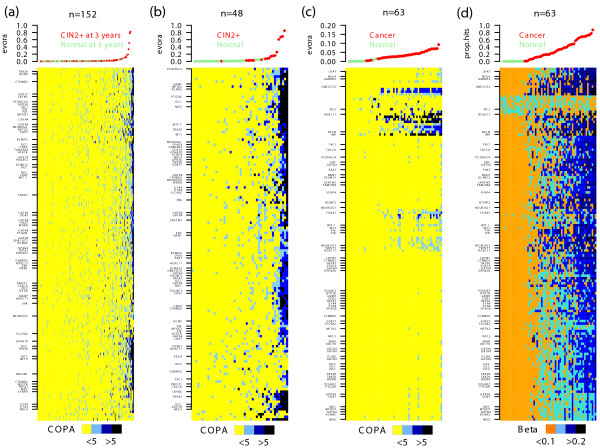
Methods: We analyzed DNA methylation (DNAm) profiles of over 27,000 CpGs in cytologically normal cells of the uterine cervix from 152 women in a prospective nested case-control study. We used statistics based on differential variability to identify CpGs associated with the risk of transformation and a novel statistical algorithm called EVORA (Epigenetic Variable Outliers for Risk prediction Analysis) to make predictions.

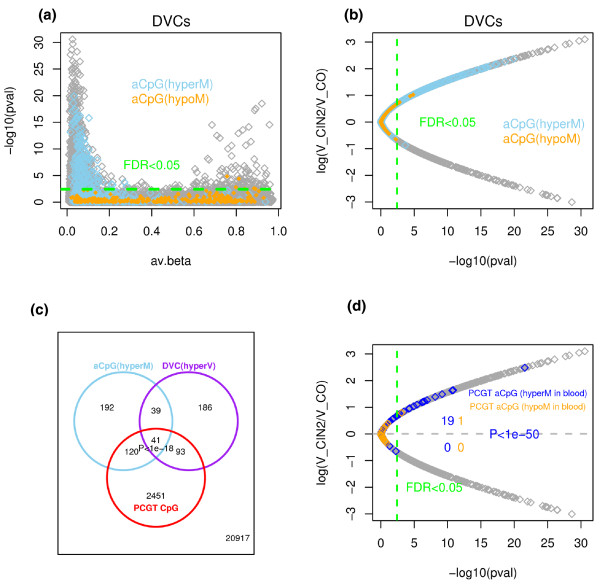
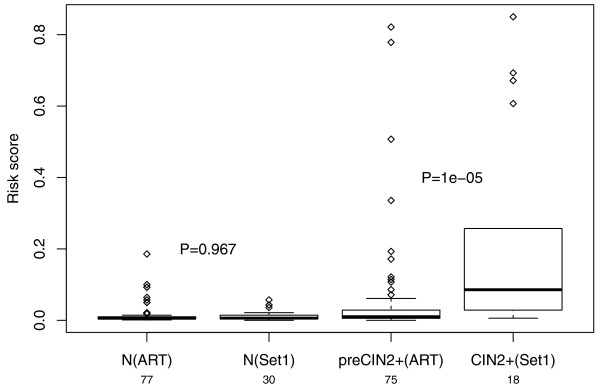
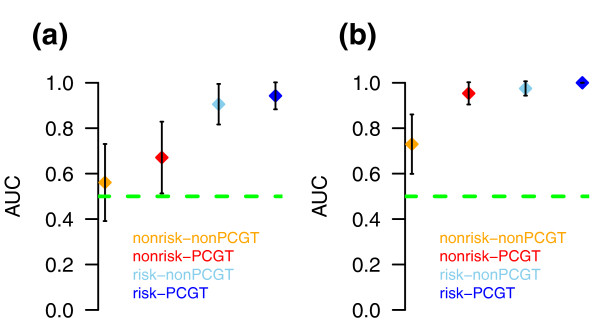
Results: We observed many CpGs that were differentially variable between women who developed a non-invasive cervical neoplasia within 3 years of sample collection and those that remained disease-free. These CpGs exhibited heterogeneous outlier methylation profiles and overlapped strongly with CpGs undergoing age-associated DNA methylation changes in normal tissue. Using EVORA, we demonstrate that the risk of cervical neoplasia can be predicted in blind test sets (AUC = 0.66 (0.58 to 0.75)), and that assessment of DNAm variability allows more reliable identification of risk-associated CpGs than statistics based on differences in mean methylation levels. In independent data, EVORA showed high sensitivity and specificity to detect pre-invasive neoplasia and cervical cancer (AUC = 0.93 (0.86 to 1) and AUC = 1, respectively).

Conclusions: We demonstrate that the risk of neoplastic transformation can be predicted from DNA methylation profiles in the morphologically normal cell of origin of an epithelial cancer. Having profiled only 0.1% of CpGs in the human genome, studies of wider coverage are likely to yield improved predictive and diagnostic models with the accuracy needed for clinical application.

Trial registration: The ARTISTIC trial is registered with the International Standard Randomised Controlled Trial Number ISRCTN25417821.


Figures

Figure 1
Figure 1
Differentially variable and differentially methylated CpGs. (a) Histograms of P-values derived from Bartlett's test comparing differences in variance between normal samples that become neoplastic (CIN2+) and samples that remain normal (differentially variable CpGs (DVCs)). (b) Histograms of P-values derived from t-tests comparing differences in mean CpG methylation levels between the same two phenotypes (differentially methylated CpGs (DMCs)). (c) Scatterplot of Bartlett statistics (logarithm of the ratio of the variance in prospective CIN2+ to that in normal) shown on the y-axis against the corresponding t-statistics (x-axis) for the top 500 DVCs. The numbers of hypervariable (hyperV) and hypovariable (hypoV) DVCs are given. (d) Typical methylation profile of a hypervariable DVC (blue = prospective CIN2+, green = normal). The thin dashed lines indicate the mean levels of methylation in each phenotype. The P-values shown are from a Bartlett's test (differential variability) and t-test (differential methylation).
Figure 2
Figure 2
Relation between differentially variable and age-associated CpGs. (a) Bartlett test P-values (on -log10 scale) of CpGs indicating significance of differential variability (between prospective CIN2+ and controls) (y-axis) versus their average β-value across all samples (x-axis). CpGs undergoing age-associated (aCpG) hypermethylation (hyperM) or hypomethylation (hypoM) are colored as indicated. (b) The ratio (on log scale) of variability in prospective CIN2+ to variability in controls (y-axis) versus significance level (x-axis). Skyblue (orange) denotes CpGs significantly hypermethylated (hypomethylated) with age (aCpGs) in normal cells from uterine cervix. The green dashed line represents the FDR cutoff value of 0.05 for calling DVCs. (c) Venn diagram illustrating overlaps of age-hypermethylated CpGs with DVCs that are hypervariable (hyperV) in prospective CIN2+, and with PCGT CpGs. A total of 41 CpGs overlapped between all three categories and 20,917 CpGs were in none of the three categories. The P-value (estimated from a multiple binomial test) indicates the random chance of observing 41 or more overlapping CpGs. (d) As (b) but now highlighting the 68 and 20 CpGs that map to PCGTs and undergo age-associated hyper- (blue) and hypomethylation (red) in whole blood samples [7]. Among these CpGs, we give the number that are significantly differentially variable (FDR < 0.05, green dashed line) and their distribution in terms of increased or decreased variance in future CIN2+ cases. P-value is from a binomial test.
Figure 3
Figure 3
Epigenetic variable outliers for risk prediction analysis. (a) Flowchart describing the EVORA model. (i) Age-associated DNAm variation and age-independent differentially variable DNAm are both correlated with the risk of prospective neoplasia (CIN2+). aCpGs undergoing age-associated hypermethylation (hyperM) overlap strongly with differential variable CpGs (DVCs) that exhibit increased variance in future CIN2+ cases. This overlap defines, for a given training set, the pool of candidate risk CpGs. (ii) Multiple training/test set partitions in a ten-fold internal cross-validation on COPA-transformed (Methods) methylation profiles is used to optimize the COPA threshold and the set of risk CpGs. (iii) Risk prediction using EVORA: for an independent sample its risk score is estimated as the fraction of risk CpGs with a β-value larger than the optimal threshold, as evaluated in the COPA-basis. (b) EVORA receiver operating characteristic (ROC) curve, AUC and its 95% confidence interval in the ARTISTIC cohort (152 normal samples: 75 future CIN2+, 77 normals). (c) Comparison of C-index (AUC) values obtained using EVORA with a classification algorithm based on detecting differences in mean methylation levels (mean) in the ARTISTIC cohort. Boxplots are over 100 distinct training-test set partitions and P-values are from a Wilcoxon test detecting deviation from the expected null (C-index = 0.5) as well as between the two classification algorithms. (d) EVORA ROC curve in set 1 (48 liquid-based cytology samples: 18 CIN2+, 30 normals). (e) EVORA ROC curve in set 2 (63 cervical tissue samples: 48 cancers, 15 normals). In all ROC curves, AUC values and 95% confidence intervals shown. FPR: false positive rate; Se: sensitivity.
Figure 4
Figure 4
Heatmaps over risk CpGs. (a-c) Heatmaps of COPA-transformed methylation values for the top 140 risk CpGs that are (i) significantly hypermethylated with age and (ii) show significant increased variability in future CIN2+ cases, as determined in the ARTISTIC cohort. Color codes for COPA scores: yellow = COPA score < 1 (no methylation); skyblue = COPA score < 5. Outliers denoted by blue = methylation COPA score > 5 and black = methylation COPA score > 10. CpGs have been hierarchically clustered using a Manhattan distance metric. Those mapping to PCGTs are labeled with their associated gene. Samples have been ordered according to their EVORA risk score as shown in the panels above heatmaps. (a) ARTISTIC cohort: 152 samples (75 prospective CIN2+ (red), 77 no CIN2+ at last follow-up (green). (b) Set 1: 48 samples (18 CIN2+ (red), 30 normals (green)). (c) Set 2: 63 cervical tissue samples (48 cancers (red), 15 normals (green)). (d) Heatmap depicts the same data matrix as in (c) but with the methylation values on the β-value scale where CpG β-values have been median normalized to zero. The corresponding scores now depict the percentage of methylation hits as measured on the beta-scale.
Figure 5
Figure 5
Cross-comparison of EVORA risk scores. Boxplots of EVORA risk scores (y-axis) of the 77 normal LBC samples in ARTISTIC (N(ART)), the 30 normal LBC samples of set 1 (N(Set1)), the 75 prospective CIN2+ LBC samples in ARTISTIC (preCIN2+(ART)), and the 18 CIN2+ samples of set 1 (CIN2+ (Set1)). Wilcox-test P-values between N(ART) and N(Set1), and between preCIN2+(ART) and CIN2+(Set1) are given.
Figure 6
Figure 6
EVORA AUC values as a function of differential variability and PCGT status. (a, b) Comparison of EVORA AUC measures for four different CpG classes in (a) set 1 consisting of 18 CIN2+ LBC samples and 30 normal LBC samples, and in (b) set 2 consisting of 48 cervical cancers and 15 cervical normal tissues. Of the 140 risk CpGs, 69 mapped to PCGTs (risk-PCGT class) and 71 did not (risk-nonPCGT class). In addition, we randomly selected 70 non-differentially variable, non-age-associated CpGs (nonrisk) that mapped and that did not map to PCGTs. The random selection was done 100 times and AUC values averaged. Also provided are 95% confidence intervals.

References

    1. Feinberg AP, Irizarry RA. Evolution in health and medicine Sackler colloquium: Stochastic epigenetic variation as a driving force of development, evolutionary adaptation, and disease. Proc Natl Acad Sci USA. 2010;107(Suppl 1):1757–1764. - PMC - PubMed
    1. Feinberg AP, Irizarry RA, Fradin D, Aryee MJ, Murakami P, Aspelund T, Eiriksdottir G, Harris TB, Launer L, Gudnason V, Fallin MD. Personalized epigenomic signatures that are stable over time and covary with body mass index. Sci Transl Med. 2010;2 49ra67. - PMC - PubMed
    1. Hansen KD, Timp W, Bravo HC, Sabunciyan S, Langmead B, McDonald OG, Wen B, Wu H, Liu Y, Diep D, Briem E, Zhang K, Irizarry RA, Feinberg AP. Increased methylation variation in epigenetic domains across cancer types. Nat Genet. 2011;43:768–775. doi: 10.1038/ng.865. - DOI - PMC - PubMed
    1. Bibikova M, Fan JB. Genome-wide DNA methylation profiling. Wiley Interdiscip Rev Syst Biol Med. 2010;2:210–223. - PubMed
    1. Kitchener HC, Almonte M, Gilham C, Dowie R, Stoykova B, Sargent A, Roberts C, Desai M, Peto J. ARTISTIC: a randomised trial of human papillomavirus (HPV) testing in primary cervical screening. Health Technol Assess. 2009;13:1–150, iii-iv. - PubMed