. 2012 Mar 27:3:758.
doi: 10.1038/ncomms1755.

FAD-dependent lysine-specific demethylase-1 regulates cellular energy expenditure

Affiliations
Free PMC article

FAD-dependent lysine-specific demethylase-1 regulates cellular energy expenditure

Shinjiro Hino et al. Nat Commun. .
Free PMC article

Abstract

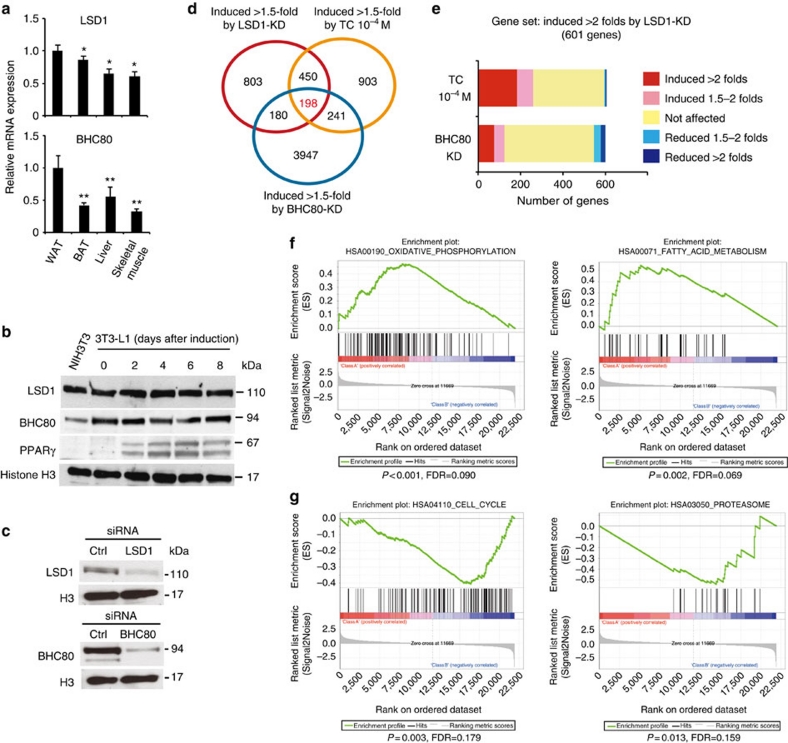
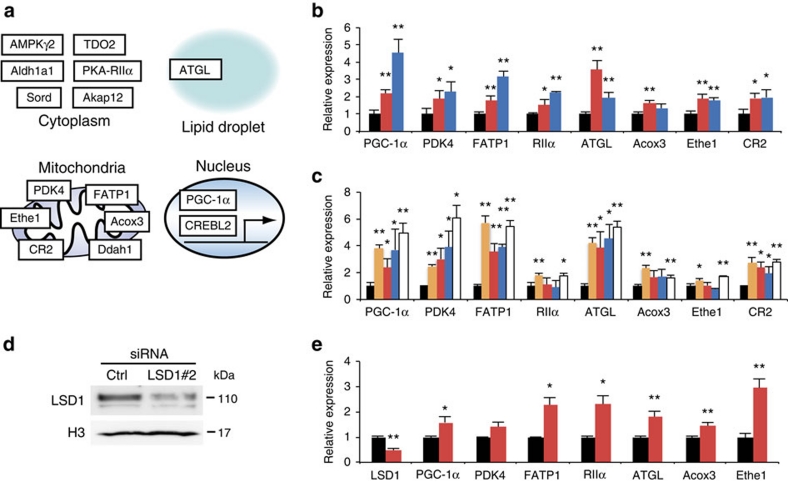
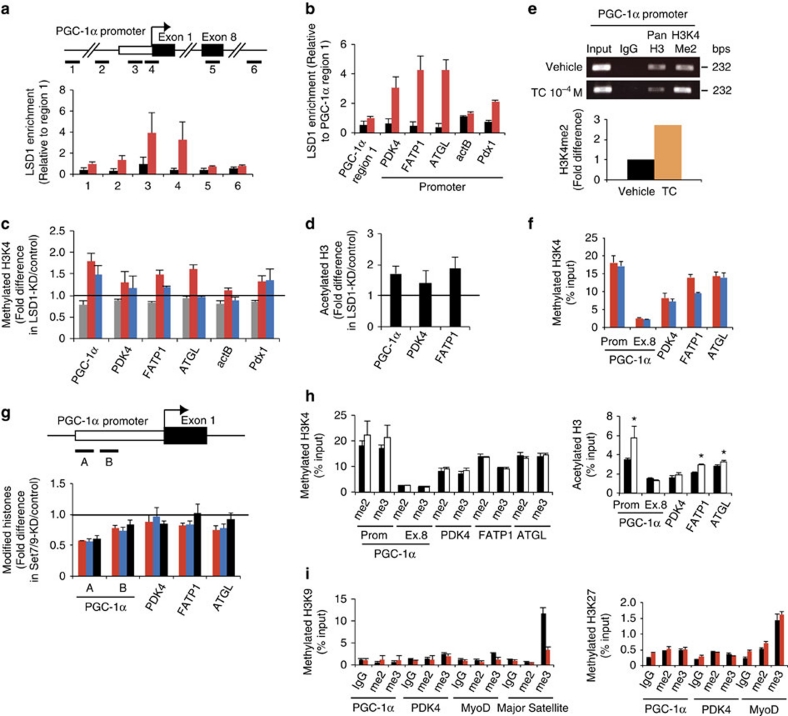
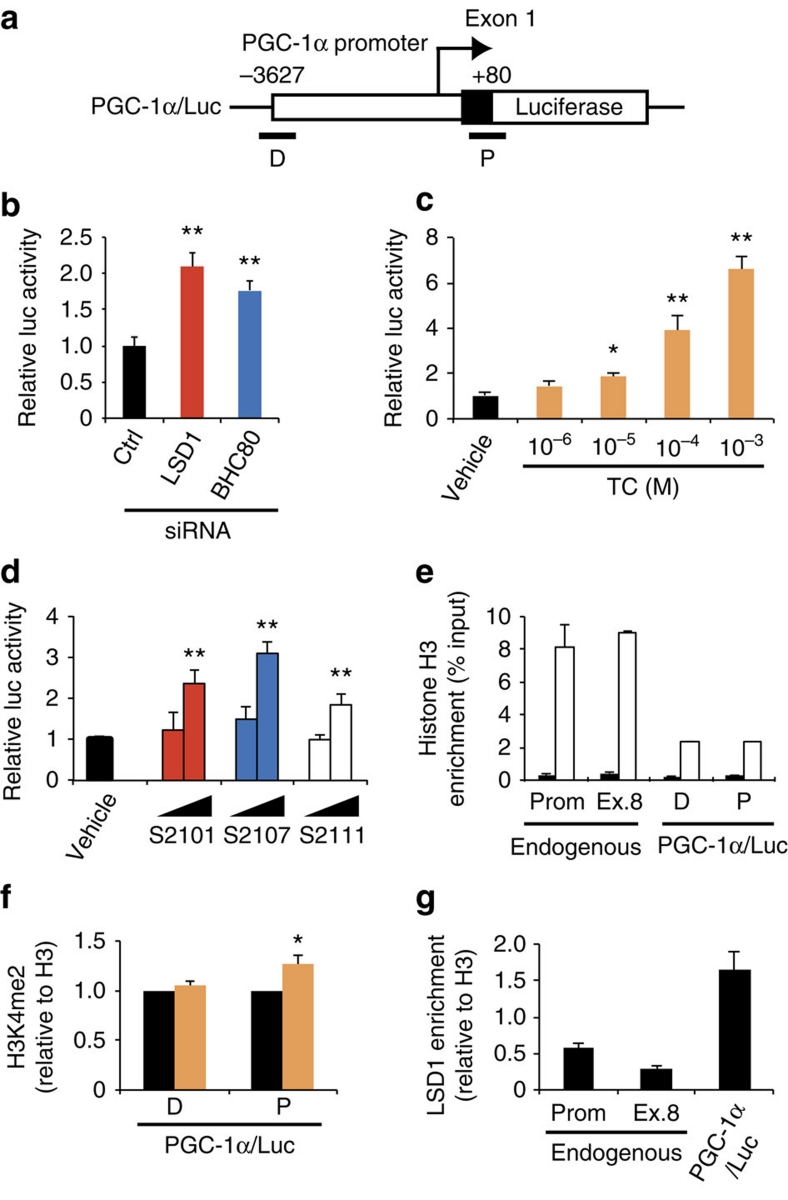
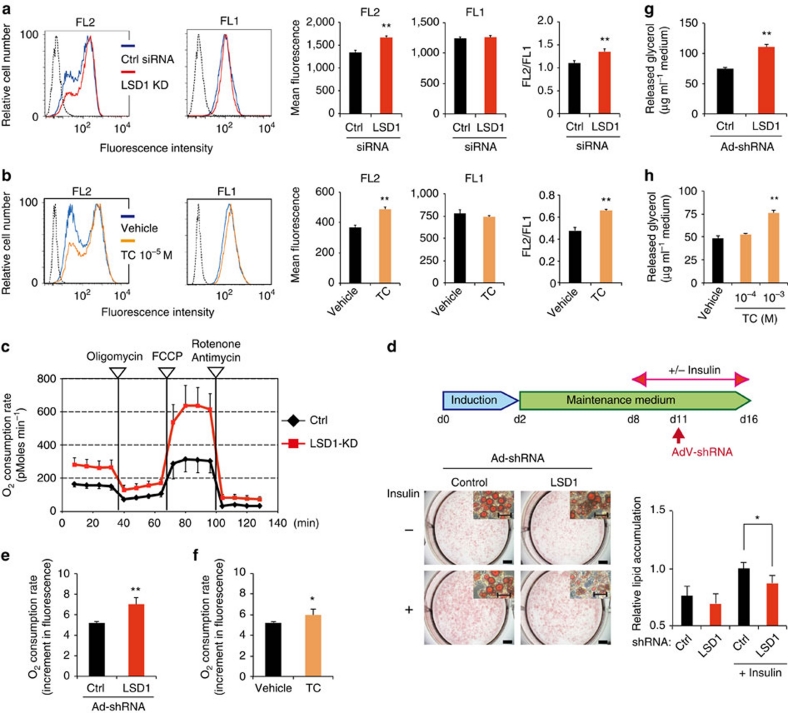
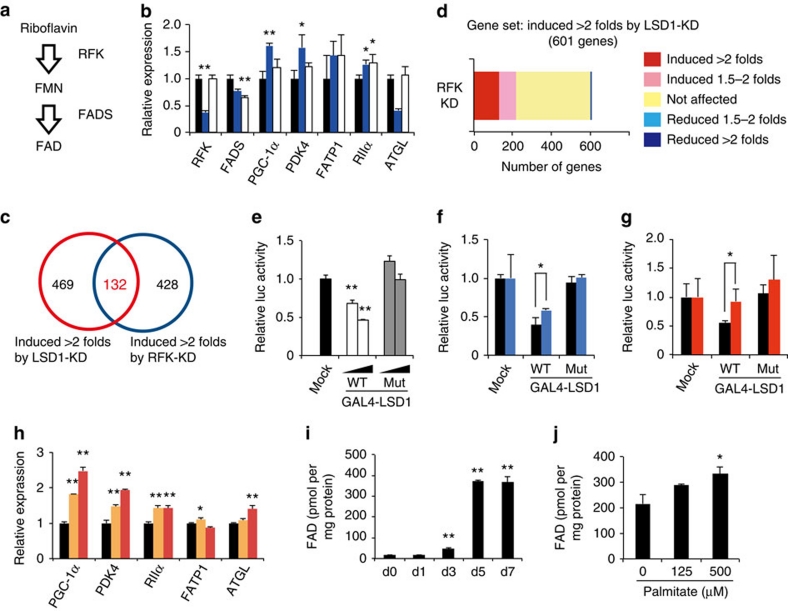
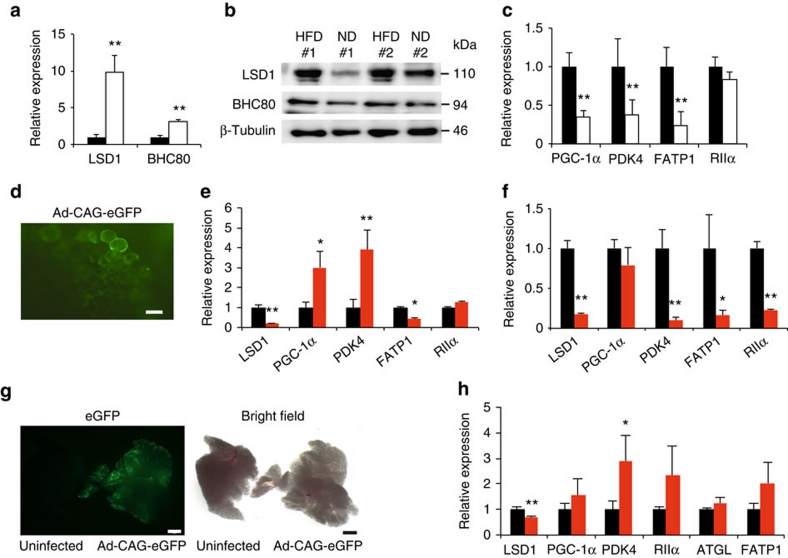
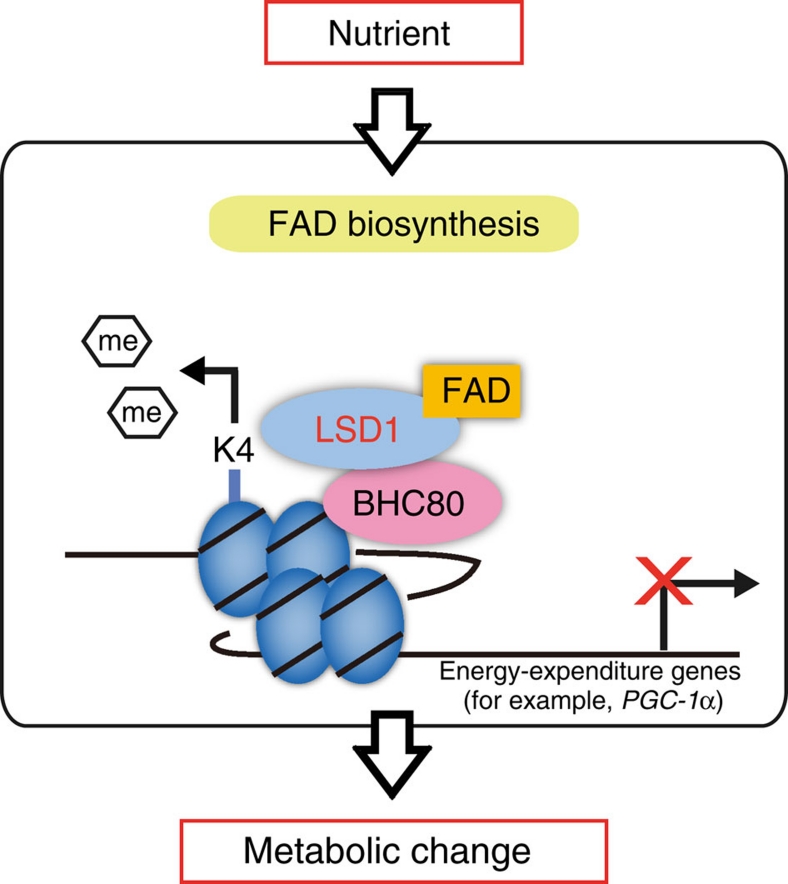
Environmental factors such as nutritional state may act on the epigenome that consequently contributes to the metabolic adaptation of cells and the organisms. The lysine-specific demethylase-1 (LSD1) is a unique nuclear protein that utilizes flavin adenosine dinucleotide (FAD) as a cofactor. Here we show that LSD1 epigenetically regulates energy-expenditure genes in adipocytes depending on the cellular FAD availability. We find that the loss of LSD1 function, either by short interfering RNA or by selective inhibitors in adipocytes, induces a number of regulators of energy expenditure and mitochondrial metabolism such as PPARγ coactivator-1α resulting in the activation of mitochondrial respiration. In the adipose tissues from mice on a high-fat diet, expression of LSD1-target genes is reduced, compared with that in tissues from mice on a normal diet, which can be reverted by suppressing LSD1 function. Our data suggest a novel mechanism where LSD1 regulates cellular energy balance through coupling with cellular FAD biosynthesis.


Figures

Figure 1
Figure 1. Genome-wide analyses of LSD1-regulated genes in adipocytes.
(a) Preferential expression of LSD1 and BHC80 in WAT. Expression of LSD1 and BHC80 mRNAs in epididymal WAT, interscapular BAT, liver and skeletal muscle. 13-week old C57BL/6J mice were fasted for 16 h before tissue dissection. Quantitative RT–PCR values were normalized to the expression levels of the housekeeping 36B4 gene, and are shown as means±s.d. of four mice. *P<0.05, **P<0.01 versus WAT by Student's t-test. (b) The protein expression of LSD1 and BHC80 in adipogenic 3T3-L1 cells. The cells were subjected to adipogenic induction as described in Methods, and were collected at the indicated time points. (c) Specific siRNA-mediated knockdown of LSD1 and BHC80 in 3T3-L1 cells. In silico analysis, using mouse genome and EST databases, confirmed the target specificities of the siRNAs. For western blot analysis, protein samples were prepared 72 h after siRNA introduction. (d) Venn diagram of the genes induced 1.5-fold or more by LSD1-knockdown (KD), BHC80-KD or TC treatment. siRNA-introduced or TC-treated 3T3-L1 cells were subjected to adipogenic induction for 24 h. Control siRNA or vehicle-treated samples were used as controls. (e) Unidirectional effects of TC and BHC80-KD on LSD1-target genes. (f) Gene set enrichment analysis of commonly upregulated genes by LSD1-KD, BHC80-KD and TC treatment. In each panel, nominal P-values and false discovery rates (FDRs) are indicated. (g) Gene set enrichment analysis of commonly downregulated genes by LSD1-KD, BHC80-KD and TC treatment. Significantly enriched gene sets are shown. Nominal P-values and FDRs are indicated.
Figure 2
Figure 2. LSD1 inhibition activates genes for energy expenditure and mitochondrial metabolism in adipocytes.
(a) Summarized illustration of co-target genes. Co-target genes , associated with energy expenditure and mitochondrial metabolism, are shown with cellular localization of the gene products. (b) Expression levels of LSD1 target genes under LSD1-KD (red bars) and BHC80-KD (blue bars). Quantitative RT–PCR values were normalized to the expression levels of the 36B4 gene, and are shown as the fold difference against control siRNA-introduced samples (black bars). (c) Expression levels of LSD1 target genes after TC (orange bars) or SLIs (S2101 (red bars), S2107 (blue bars), S2111 (white bars)) treatment. TC and SLIs were used at the concentrations of 10−4 M and 10−5 M, respectively. Values are shown as the fold difference against vehicle-treated samples (black bars). (d) The knockdown of LSD1 using an alternative siRNA (LSD1#2). (e) The effect of LSD1 siRNA#2 on the expression of newly identified LSD1-target genes. Values are shown as the fold difference against control siRNA-introduced samples (black bars). All histogram data are means±s.d. of triplicate results. *P<0.05, **P<0.01 versus control by Student's t-test.
Figure 3
Figure 3. Epigenetic repression of energy-expenditure genes by LSD1.
After 24-hour adipogenic induction, 3T3-L1 cells were examined for LSD1 enrichment and histone modifications by ChIP–qPCR. Before the induction, cells were subjected to siRNA introduction or drug treatment, as specified below. Each ChIP–qPCR histogram indicates the mean±s.d. of triplicate results. (a) Localization of LSD1 at the PGC-1α gene locus. ChIP analyses were performed in 3T3-L1 cells after 24-hour adipogenic induction using anti-LSD1 antibody. Six indicated sites (1–6) were tested for qPCR amplification. Enrichment values were normalized to input, and shown as the fold difference relative to region 1. Control IgG (black bars), anti-LSD1 antibody (red bars). (b) LSD1 occupancy at PDK4, FATP1 ATGL, actB and Pdx1 gene promoters. LSD1 occupancy was calculated as the enrichment level relative to PGC-1α gene exon 8. Control IgG (black bars), anti-LSD1 antibody (red bars). (c) ChIP analyses of the target gene promoters using antibodies against mono- (grey bars), di- (red bars) and tri-methylated (blue bars) H3K4. The enrichment values are shown as the fold difference relative to control siRNA-introduced cells. (d) Histone H3 acetylation levels of LSD1-target promoters after LSD1-KD. (e) Enrichment of di-methylated H3K4 at the PGC-1α gene promoter in TC-treated cells. Three independent assays had similar results. (f) Di- (red bars) and tri-methylation (blue bars) levels of H3K4 on LSD1-regulated genes. Values indicate percentage of input DNA. (g) Histone modification levels of LSD1 target promoters after Set7/9-KD. The enrichment values of di- (red bars), tri- (blue bars) methylated H3K4 and acetylated H3 (black bars) are shown as the fold difference relative to control siRNA-introduced cells. (h) Effect of TSA treatment on H3K4 methylation (left panel) and H3 acetylation (right panel). Cells were cultured with vehicle (white bars) or with 100 nM TSA (black bars) before adipogenic induction. *P<0.05 versus vehicle by Student's t-test. (i) Repressive histone marks in LSD1-KD (red bars) and control (black bars) cells. ChIP experiments were done using antibodies against di- and tri-methylated H3K9 (left panel) and di- and tri-methylated H3K27 (right panel). MyoD gene and major satellite repeat were included as experimental controls.
Figure 4
Figure 4. Transcriptional repression of PGC-1α promoter by LSD1.
(a) Diagram of PGC-1α/Luc construct. Sites of ChIP–qPCR primers are indicated as D (distal) and P (proximal). (b) Effects of LSD1-KD and BHC80-KD on PGC-1α promoter activity. After the introduction of indicated siRNAs, 3T3-L1 cells were transfected with a PGC-1α/Luc plasmid and an internal control pRL-TK construct. Luciferase activities were measured at 24 h after the adipogenic induction. (c,d) Effects of LSD1 inhibitors on PGC-1α gene promoter activity. TC (c) was used at the indicated concentrations whereas SLIs (d) were used at 10−6 and 10−5 M. Reporter-introduced cells were treated with indicated drugs for 24 h before the adipogenic induction. (e) Chromatin formation on transfected reporter plasmid. Pan-histone H3 (white bars) and control IgG (black bars) levels were analysed both on endogenous and transgenic PGC-1α promoter. (f) H3K4 di-methylation level of the reporter vector after vehicle (black bars) or 10−4 M TC (orange bars) treatment. Values are normalized to the enrichment level of panH3. (g) LSD1-binding on the reporter vector. Values are normalized to the enrichment level of panH3. Values are mean±s.d. of triplicate samples. *P<0.05, **P<0.01 versus control siRNA or vehicle by Student's t-test.
Figure 5
Figure 5. LSD1 inhibition enhances mitochondrial metabolism in adipocytes.
Mitochondrial energy metabolism was assessed in differentiating 3T3-L1 cells under LSD1-KD (a) and TC treatment (b). siRNA-introduced or drug-treated cells were subjected to adipogenic induction for 24 h, and were stained with JC-1 followed by flow cytometric analyses. Red fluorescent JC-1 aggregates (FL2) and green fluorescent monomers (FL1) were measured. Hatched histograms indicate the unstained control samples. Each histogram shows the representative result of triplicate samples. (c) The effect of LSD1-KD on the OXPHOS capacity of differentiating 3T3-L1 cells. OXPHOS activity was determined by measuring the OCR using the XF24 Analyzer. During the real-time measurement, respiratory chain inhibitors were added to the culture at the indicated time points. Values are means±s.d. of five assay wells at each time point. (d) LSD1-KD reduces lipid accumulation in insulin-stimulated adipocytes. Differentiated 3T3-L1 cells were cultured in the absence or presence of insulin, followed by adenovirus-mediated introduction of LSD1 shRNA (Ad-shLSD1) or control (Ad-sh-ctrl). Cellular lipid was analysed at 4 days after infection. Values are means±s.d. of five mice. Scale bars in the whole-well and magnified images indicate 5 mm and 50 μm, respectively. (e,f) The effects of LSD1-KD and TC treatment on the OCR in mature 3T3-L1 adipocytes. Insulin-stimulated adipocytes were treated with shRNA-containing adenoviruses (control or LSD1, e) or 10−4 M TC (f), and cultured for 4 days. OCR was determined using the Oxygen Biosensor System, and was calculated as the fold increase during 30 min-measurement. (g,h) Enhanced lipolysis in LSD1-inhibited adipocytes. Insulin-stimulated mature 3T3-L1 adipocytes were infected with shRNA-containing adenovirus (g) or were treated with TC (h), and cultured for 4 days. All values (except for those in c) are means±s.d. of three independent samples. *P<0.05, **P<0.01 versus control siRNA, control shRNA or vehicle by Student's t-test
Figure 6
Figure 6. Inhibition of cellular FAD synthesis blocks LSD1-mediated repression of energy-expenditure genes.
(a) Biosynthesis pathway of FAD in mammalian cells. Flavin mononucleotide (FMN). (b) Effect of the disruption of FAD synthesis on LSD1-target genes. RFK- (blue bars) or FADS- (white bars) knockdown 3T3-L1 cells were induced to differentiate for 24 h, followed by RNA extraction and quantitative RT–PCR. Values are shown as the fold difference against control siRNA-introduced samples (black bars). *P<0.05, **P<0.01 versus control siRNAs by Student's t-test. (c) Venn diagram of the probe sets induced by LSD1-KD and RFK-KD. (d) Unidirectional effects of RFK-KD on LSD1-target genes. (e) Effect of wild-type or FAD-binding mutant-type LSD1 on promoter activity. GAL4-fused LSD1-expressing plasmid (0.1 or 0.5 μg) was transfected into 293T cells, together with the GAL4x5-containing luciferase reporter construct. **P<0.01 versus GAL4 mock by Student's t-test. (f) Effect of RFK-KD on LSD1-mediated transcriptional repression. Control (black bars) or RFK (blue bars) siRNA-introduced 3T3-L1 cells were transfected with indicated GAL4 plasmids 48 h before the luciferase measurement. *P<0.05 between indicated conditions by Student's t-test. (g) Effect of lumiflavin treatment on LSD1-mediated transcriptional repression. 3T3-L1 cells were exposed to vehicle (black bars) or 50 μM lumiflavin (red bars) 48 h before the luciferase measurement. (h) Effect of lumiflavin on endogenous LSD1-target genes. Differentiating 3T3-L1 cells were exposed to vehicle (black bars), 25 μM (orange bars) or 50 μM (red bars) lumiflavin for 24 h and were subjected to RNA analyses. (i) Increase of FAD concentration during adipogenic differentiation of 3T3-L1 cells. **P<0.01 versus day 0 by Student's t-test. (j) Increase of FAD concentration after 24-hour palmitate exposure in mature 3T3-L1 adipocytes (day 7). Values are normalized to the protein concentration. *P<0.05 versus control by Student's t-test. All histogram values are means±s.d. of three independent samples.
Figure 7
Figure 7. Inhibition of LSD1 induces energy-expenditure genes in obese adipose tissues.
(a,b) Expression of LSD1 and BHC80 in epididymal WAT from ND (black bars) and HFD- (white bars) fed mice. After a 16-hour fasting period, epididymal WAT was collected, and the total RNA was used for quantitative RT–PCR (a). The expression level of the 36B4 gene was used as the internal control. Protein levels are shown by western blot analysis (b). (c) Expression of LSD1 target genes in ND- (black bars) and HFD- (white bars) fed mice. Values are means±s.d. of four mice, and are shown as fold changes relative to ND-fed mice. **P<0.01 versus ND-fed mice by Student's t-test. (d) Efficient introduction of adenovirus vector into cultured WAT. Adenovirus vector, Ad-CAG-eGFP was introduced into isolated epididymal WAT, and the eGFP expression was analysed by fluorescence microscopy. Scale bar indicates 50 μm. (e,f) Expression of energy-expenditure genes after adenovirus-mediated knockdown of LSD1 gene in cultured WAT ex vivo. Epididymal WAT was dissected from either HFD- (e) or ND-fed mice (f), followed by the infection of adenoviruses, Ad-shLSD1 (red bars) or Ad-sh control (black bars). (g) Efficient introduction of adenoviral vectors into epididymal WAT in vivo. Adenovirus vectors carrying the eGFP gene (Ad-CAG-eGFP) was injected into epididymal WAT after incising the outer coat of mice. Four days later, tissues were isolated for the microscopic analysis. Scale bar indicates 2 mm. (h) Expression of energy-expenditure genes after adenovirus-mediated reduction of LSD1 in epididymal WAT in vivo. Control (black bars) or LSD1 (red bars) shRNA-carrying adenoviruses were directly injected into epididymal WAT of HFD-fed mice 4 days before tissue isolation. Values are means±s.d. of triplicate samples. *P<0.05, **P<0.01 versus control shRNA by Student's t-test.
Figure 8
Figure 8. Schematic model of LSD1 function in the metabolic gene regulation.
Schematic model for the epigenetic regulation of energy metabolism by LSD1. FAD-dependent LSD1 facilitates metabolic changes through the repression of energy-expenditure genes via H3K4 demethylation. This pathway may be influenced by nutrients and/or fluctuating FAD level, implicating the link between energetic information and the epigenome.

References

    1. Cloos P. A., Christensen J., Agger K. & Helin K. Erasing the methyl mark: histone demethylases at the center of cellular differentiation and disease. Genes Dev. 22, 1115–1140 (2008). - PMC - PubMed
    1. Felsenfeld G. & Groudine M. Controlling the double helix. Nature 421, 448–453 (2003). - PubMed
    1. Teperino R., Schoonjans K. & Auwerx J. Histone methyl transferases and demethylases; can they link metabolism and transcription? Cell Metab. 12, 321–327 (2010). - PMC - PubMed
    1. Gluckman P. D. & Hanson M. A. The developmental origins of the metabolic syndrome. Trends Endocrinol. Metab. 15, 183–187 (2004). - PubMed
    1. Gallou-Kabani C. & Junien C. Nutritional epigenomics of metabolic syndrome: new perspective against the epidemic. Diabetes 54, 1899–1906 (2005). - PubMed

Publication types

MeSH terms

Associated data