. 2012 May 25;287(22):17914-29.
doi: 10.1074/jbc.M111.302794. Epub 2012 Mar 27.

α-Synuclein controls mitochondrial calcium homeostasis by enhancing endoplasmic reticulum-mitochondria interactions

Affiliations

α-Synuclein controls mitochondrial calcium homeostasis by enhancing endoplasmic reticulum-mitochondria interactions

Tito Calì et al. J Biol Chem. .

Abstract

α-Synuclein has a central role in Parkinson disease, but its physiological function and the mechanism leading to neuronal degeneration remain unknown. Because recent studies have highlighted a role for α-synuclein in regulating mitochondrial morphology and autophagic clearance, we investigated the effect of α-synuclein in HeLa cells on mitochondrial signaling properties focusing on Ca(2+) homeostasis, which controls essential bioenergetic functions. By using organelle-targeted Ca(2+)-sensitive aequorin probes, we demonstrated that α-synuclein positively affects Ca(2+) transfer from the endoplasmic reticulum to the mitochondria, augmenting the mitochondrial Ca(2+) transients elicited by agonists that induce endoplasmic reticulum Ca(2+) release. This effect is not dependent on the intrinsic Ca(2+) uptake capacity of mitochondria, as measured in permeabilized cells, but correlates with an increase in the number of endoplasmic reticulum-mitochondria interactions. This action specifically requires the presence of the C-terminal α-synuclein domain. Conversely, α-synuclein siRNA silencing markedly reduces mitochondrial Ca(2+) uptake, causing profound alterations in organelle morphology. The enhanced accumulation of α-synuclein into the cells causes the redistribution of α-synuclein to localized foci and, similarly to the silencing of α-synuclein, reduces the ability of mitochondria to accumulate Ca(2+). The absence of efficient Ca(2+) transfer from endoplasmic reticulum to mitochondria results in augmented autophagy that, in the long range, could compromise cellular bioenergetics. Overall, these findings demonstrate a key role for α-synuclein in the regulation of mitochondrial homeostasis in physiological conditions. Elevated α-synuclein expression and/or eventually alteration of the aggregation properties cause the redistribution of the protein within the cell and the loss of modulation on mitochondrial function.


Figures
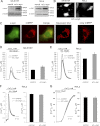
FIGURE 1.
FIGURE 1.
Western blotting analysis, immunolocalization, and Ca2+ measurements in wt α-synuclein-overexpressing cells. SH-SY5Y or HeLa cells were transfected with wt α-syn expression plasmid and analyzed by Western blotting (A) or immunocytochemistry (B). C, shown are HeLa cells co-transfected with mtRFP and α-syn or transfected with mtRFP only. The merge image revealed no colocalization between α-syn and mtRFP. Gaussian blur analysis was performed with ImageJ software to remove the signal out of focus. mtRFP fluorescence revealed intact filamentous mitochondrial morphology in α-syn-expressing cells as in cells transfected only with mtRFP. Mitochondrial Ca2+ transients, [Ca2+]m, in SH-SY5Y (D) or HeLa cells (E) overexpressing α-syn are shown. Cells were transfected with mtAEQ (control) or co-transfected with mtAEQ and wt α-syn. Bars represent the mean [Ca2+] values upon stimulation. Results are the mean ± S.E. **, p < 0.001. The traces are representative of at least nine independent experiments. Cytosolic ([Ca2+]c) (F) and ER ([Ca2+]er) (G) Ca2+ concentration in HeLa cells overexpressing wt α-syn are shown. Cells were transfected with cytAEQ or erAEQ (control) or co-transfected with cytAEQ or erAEQ and wt α-syn. Bars represent the mean [Ca2+] values upon stimulation (F) and resting [Ca2+] (G). Results are the mean ± S.E. Panel G shows the kinetics of ER refilling upon re-addition of CaCl2 1 mm to Ca2+-depleted cells (see “Experimental Procedures”). The traces are representative of at least 13 independent experiments. Where indicated 100 nm bradykinin or 100 μm histamine, two InsP3 generating agonists, were applied.
FIGURE 2.
FIGURE 2.
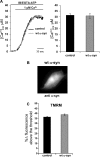
Mitochondrial Ca2+ uptake in permeabilized cells and mitochondrial membrane potential are not affected by wt α-synuclein overexpression. A, shown are representative traces (left) and average plateau [Ca2+]m values (right, results are the mean ± S.E.) reached in permeabilized cells exposed to 1 μm Ca2+-buffered solution. Where indicated, the medium was switched from IB/EGTA-ATP to IB/1 μm Ca2+. The traces are representative of at least 14 independent experiments. B, shown is immunocytochemistry analysis on permeabilized HeLa cells overexpressing wt α-syn. The staining with monoclonal antibody against α-syn was revealed by AlexaFluor 488-conjugated antibody. C, HeLa cells (control and overexpressing wt α-syn) were loaded with TMRM probe to determine the mitochondrial membrane potential (ΔΨ). Bars represent the average TMRM fluorescence signals subtracted of signals remaining after FCCP treatment to collapse ΔΨ and are expressed as % Δ fluorescence. The analysis was performed on n = 124 mock cells and on n = 209 α-syn-overexpressing cells.
FIGURE 3.
FIGURE 3.
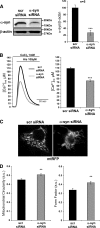
Silencing of α-synuclein impairs mitochondrial Ca2+ transients and morphology. A, shown are Western blotting and densitometric analysis of siRNA-mediated silencing of endogenous α-syn in HeLa cells. Results are the mean ± S.E. ***, p < 0.0001. B, mitochondrial Ca2+ transients were induced by cell stimulation, where 100 μm histamine was applied. The traces are representative of at least eight independent experiments. Bars indicate the average heights of peak values. Results are the mean ± S.E. ***, p < 0.0001. C, α-syn siRNA or Scr siRNA and mtRFP were co-transfected in HeLa cells. After 36–48 h cells were observed under fluorescence microscope to evaluate mitochondrial morphology. The panel displays representative mitochondrial phenotypes observed by monitoring mtRFP fluorescence. D, shown is quantification of mitochondrial morphology by calculating mitochondrial circularity and form factor (see “Experimental Procedures” for details). a.u., arbitrary units. A value of 1 corresponds to a perfect circle. Results are the mean ± S.E., **, p < 0.005, n = 25 cells/conditions, two independent experiments.
FIGURE 4.
FIGURE 4.
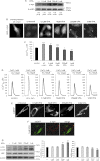
Dose-dependent valproic acid treatment increases the endogenous content of α-synuclein, induces its redistribution to cytoplasmic foci, and affects mitochondrial Ca2+ transients and autophagic process. HeLa cells were incubated with VPA in DMEM at 37 °C in CO2 atmosphere for 6 days at the indicated doses and then transfected with mtAEQ or mtRFP or mtGFP. Western blotting (A) and immunocytochemistry analysis (B) of α-syn expression levels and distribution after VPA treatment is shown. Numbers in panel A refer to normalized α-syn/β-actin ratio ± S.E. in four independent Western blottings. Statistical analysis (C) and representative experiments (D) of mitochondrial Ca2+ measurements in HeLa cells treated with VPA are shown. Results are the mean ± S.E. ***, p < 0.0001; **, p < 0.005; *, p < 0.01; NS, not significant. Where indicated the cells were stimulated with 100 μm histamine. The traces are representative of at least five independent experiments. E, mitochondrial morphology in HeLa cells treated with VPA was evaluated under fluorescent microscope by observing cotransfected mtRFP. F, immunocytochemistry analysis with anti α-syn antibody in HeLa cells treated with 1 mm VPA and transfected with mtGFP is shown. No α-syn and mtGFP colocalization was observed in these conditions. G, Western blotting analysis of LC3 I, LC3 II, and p62 levels in VPA-treated cells is shown; β-actin levels were also shown. Bars indicate the average values obtained by densitometric analysis of five independent experiments. Results are the mean ± S.E. **, p < 0.001.
FIGURE 5.
FIGURE 5.
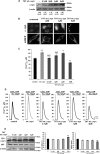
Dose-dependent TAT-mediated wt α-synuclein delivery and effects on mitochondrial Ca2+ transients and autophagic process. HeLa cells were transfected with mtGFP or mtAEQ and then incubated with the indicated doses of TAT wt α-syn. Western blotting (A) and immunolocalization (B) of TAT wt α-syn are shown. Numbers in panel A refer to normalized α-syn/β-actin ratio ± S.E. in three independent Western blottings. Shown is statistical analysis (C) and representative experiments (D) of mitochondrial Ca2+ measurements in HeLa cells treated with TAT wt α-syn. Where indicated the cells were stimulated with 100 μm histamine. Bars represent the mean [Ca2+] values upon stimulation. Results are the mean ± S.E. ***, p < 0.0005; **, p < 0.005; NS, not significant. The traces are representative of at least four independent experiments. E, shown is Western blot analysis of LC3 I, LC3 II, and p62 levels in TAT α- syn-treated cells; β-actin levels were also shown. Bars indicate the average values obtained by densitometric analysis of four independent experiments. Results are the mean ± S.E. **, p < 0.001.
FIGURE 6.
FIGURE 6.
Immunolocalization, Western blotting analysis, and Ca2+ measurements in HeLa cells expressing the C-terminal-truncated α-synuclein 1–97 mutant. HeLa cells were co-transfected with mtAEQ and α-syn-(1–97) or transfected with mtAEQ and empty vector (control). Two different constructs expressing α-syn-(1–97) were used: an untagged version in A and B and a myc-tagged construct in C–F. A wt α-syn myc construct was used as comparison. Immunolocalization (A) and mitochondrial Ca2+ measurements (B) in HeLa cells overexpressing α-syn-(1–97) are shown. Immunolocalization (C), Western blotting analysis (D), and mitochondrial (E) and cytosolic (F) Ca2+ measurements in HeLa cells overexpressing wt α-syn myc or α-syn-(1–97) myc are shown. Bars represent mean Ca2+ values upon stimulation. Results are the mean ± S.E. **, p < 0.001. Where indicated the cells were stimulated with 100 μm histamine. The traces are representative of at least 10 independent experiments.
FIGURE 7.
FIGURE 7.
Evaluation of autophagy process in α-syn-overexpressing cells and in siRNA α-syn-treated cells. Western blotting analysis of LC3 I, LC3 II in wt α-syn and α-syn-(1–97)-overexpressing cells (A) or in α-syn siRNA-treated cells (B and C) both in the absence and in the presence of bafilomycin treatment; β-actin levels were also shown. Bars indicate the average values obtained by densitometric analysis of four independent experiments. Results are the mean ± S.E. **, p < 0.001.
FIGURE 8.
FIGURE 8.
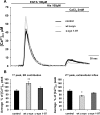
Evaluation of the contribution of ER Ca2+ mobilization and of Ca2+ influx from the extracellular ambient on mitochondrial Ca2+ transients in wt and α-synuclein 1–97-overexpressing cells. HeLa cells were co-transfected with mtAEQ and α-syn constructs or transfected with mtAEQ only (control). To discriminate the contributions to [Ca2+]m transients, InsP3-induced Ca2+ release from intracellular stores was separated from the concomitant Ca2+ influx across the plasma membrane. A, HeLa cells were perfused in KRB/EGTA 100 μm buffer and stimulated with histamine to release Ca2+ from the intracellular stores (first peak). Then, the perfusion medium was switched to KRB/Ca2+ 2 mm (in the continuous presence of histamine) to stimulate Ca2+ entry from the extracellular ambient (second peak). The traces are representative of at least 13 independent experiments. B, bars represent normalized mean [Ca2+] values upon stimulation, and results are the mean ± S.E. **, p < 0.001; *, p < 0.01.
FIGURE 9.
FIGURE 9.
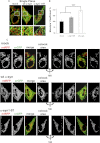
ER-mitochondria interactions in HeLa cells overexpressing wt α-synuclein and truncated α-synuclein 1–97. A, shown are single plane confocal images showing ER (green, erGFP) and mitochondria (red, mtRFP) co-localization in mock or wt -syn or wt α-syn-(1–97)-transfected cells. Insets at higher magnification are also shown. B, bars represent normalized Manders' coefficient values calculated from z-axis confocal stacks. At least 21 cells were analyzed for each conditions (results are the mean ± S.E. ***, p < 0.0001). C, shown is three-dimensional reconstruction of mitochondria and ER in HeLa cells coexpressing mtRFP and an erGFP together with the void vector (mock), wt α-syn, or α-syn-(1–97) as indicated in each panel. Cells were excited separately at 488 or 543 nm, and the single images were recorded. The merging of the two images is shown for each condition. Yellow indicates colocalization of the two organelles. A better view of the area of colocalization is provided by the panels on the right. Confocal stacks were acquired every 0.2 μm along the z axis (for a total of 40 images) with a 63× objective.

Similar articles

Cited by

References

    1. Hirsch E. C., Hunot S., Faucheux B., Agid Y., Mizuno Y., Mochizuki H., Tatton W. G., Tatton N., Olanow W. C. (1999) Dopaminergic neurons degenerate by apoptosis in Parkinson disease. Mov. Disord. 14, 383–385 - PubMed
    1. Spillantini M. G., Schmidt M. L., Lee V. M., Trojanowski J. Q., Jakes R., Goedert M. (1997) α-Synuclein in Lewy bodies. Nature 388, 839–840 - PubMed
    1. Thomas B., Beal M. F. (2007) Parkinson disease. Hum. Mol. Genet. 16, R183–R194 - PubMed
    1. Shavali S., Brown-Borg H. M., Ebadi M., Porter J. (2008) Mitochondrial localization of α-synuclein protein in α-synuclein-overexpressing cells. Neurosci. Lett. 439, 125–128 - PMC - PubMed
    1. Cole N. B., Dieuliis D., Leo P., Mitchell D. C., Nussbaum R. L. (2008) Mitochondrial translocation of α-synuclein is promoted by intracellular acidification. Exp. Cell Res. 314, 2076–2089 - PMC - PubMed

Publication types

LinkOut - more resources