. 2012 Jun;22(6):1173-83.
doi: 10.1101/gr.132563.111. Epub 2012 Mar 27.

A quantitative atlas of polyadenylation in five mammals

Affiliations

A quantitative atlas of polyadenylation in five mammals

Adnan Derti et al. Genome Res. 2012 Jun.

Abstract

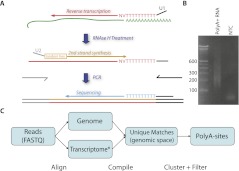
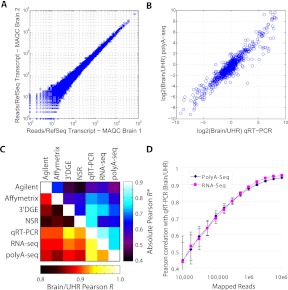
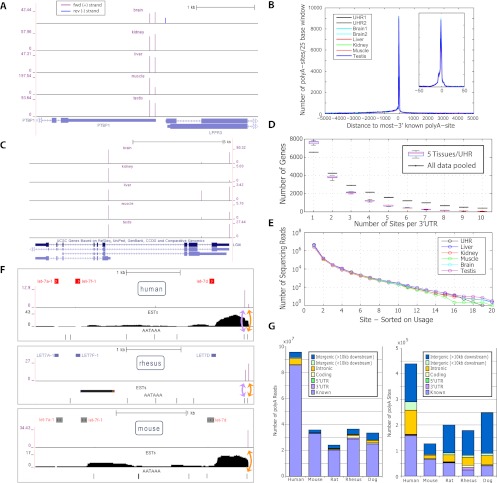
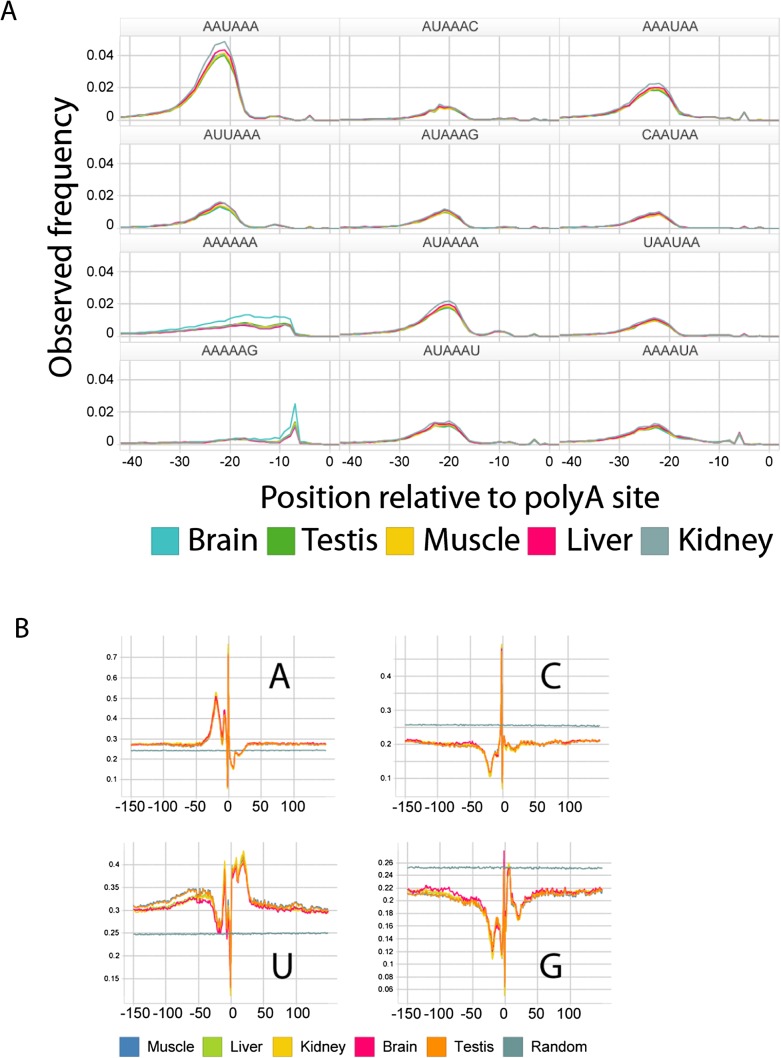
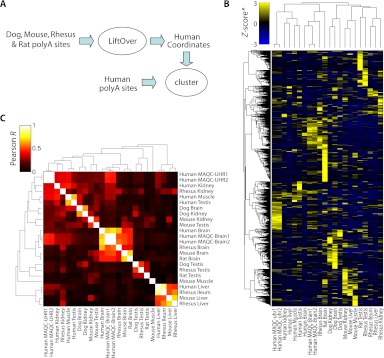
We developed PolyA-seq, a strand-specific and quantitative method for high-throughput sequencing of 3' ends of polyadenylated transcripts, and used it to globally map polyadenylation (polyA) sites in 24 matched tissues in human, rhesus, dog, mouse, and rat. We show that PolyA-seq is as accurate as existing RNA sequencing (RNA-seq) approaches for digital gene expression (DGE), enabling simultaneous mapping of polyA sites and quantitative measurement of their usage. In human, we confirmed 158,533 known sites and discovered 280,857 novel sites (FDR < 2.5%). On average 10% of novel human sites were also detected in matched tissues in other species. Most novel sites represent uncharacterized alternative polyA events and extensions of known transcripts in human and mouse, but primarily delineate novel transcripts in the other three species. A total of 69.1% of known human genes that we detected have multiple polyA sites in their 3'UTRs, with 49.3% having three or more. We also detected polyadenylation of noncoding and antisense transcripts, including constitutive and tissue-specific primary microRNAs. The canonical polyA signal was strongly enriched and positionally conserved in all species. In general, usage of polyA sites is more similar within the same tissues across different species than within a species. These quantitative maps of polyA usage in evolutionarily and functionally related samples constitute a resource for understanding the regulatory mechanisms underlying alternative polyadenylation.


Figures

Figure 1.
Figure 1.
(A) Schematic overview of PolyA-seq. Input was polyA+ selected RNA (green). Reverse transcription using U1-T10VN was followed by RNase H treatment to degrade RNA. Second-strand synthesis using U2-N6 was achieved through a random-primed Klenow extension. U1 and U2 have sequence complementarity to Illumina-specific adapters, which are added through PCR. This yields DNA libraries that can be directly sequenced. (B) A typical library consists of amplicons ranging from 200 to 500 bp (Illumina adapters account for 79 bp). (NTC) No-template control. (C) Computational procedure: reads were aligned to the genome and transcriptome ([*] defined here as known and predicted splice junctions extracted from UCSC Known Genes, RefSeq, and Ensembl, followed by conversion to genomic coordinates; see Methods for more details). Matches with unique loci were then filtered on internal priming potential and clustered into polyA sites.
Figure 2.
Figure 2.
PolyA-seq DGE. (A) DGE correlation of MAQC Human Brain technical replicates independently processed from total RNA (Pearson r = 0.994). (B) DGE correlation of PolyA-seq with MAQC qRT–PCR for Brain/UHR ratio (r = 0.948). (C) Correlation values among commonly used expression technologies applied to MAQC (Shi et al. 2006) samples. Bottom, left of diagonal are correlations based on Brain/UHR ratios; top, right are correlations based on the absolute expression values (average r of brain vs. brain and UHR vs. UHR). All comparison data are published: qRT–PCR (Shi et al. 2006), Agilent (Shi et al. 2006) and Affymetrix (Shi et al. 2006) microarray data, RNA-seq (Bullard et al. 2010), 3′DGE (Asmann et al. 2009), NSR (Armour et al. 2009). (D) Pearson correlations of Brain/UHR qRT–PCR improve with increasing numbers of mapped reads for PolyA-seq and RNA-seq. Values represent the average from 100 random sampling iterations and error bars indicate standard deviation. See Methods for further details on processing of expression data.
Figure 3.
Figure 3.
Assessment of basic features of the PolyA-seq atlas. (A) PolyA-seq detects polyA sites in a strand-specific manner. Two polyA sites (vertical spikes) are detected in human splicing factor PTBP1 (forward genomic strand, indicated by arrows) in all tissues, while LPPR3 (reverse strand) has a single polyA site, detected only in brain. Y-axis units are reads per million (see Methods; note that y-axis scales vary among tissues). PolyA-seq sites on the forward and reverse genomic strands are shown in different colors. (B) Human sites agree to single-base precision with known transcript termini. Known termini represent the 3′-most site reported by RefSeq, UCSC KG, or Ensembl per gene. (C) PolyA-seq reveals constitutive and tissue-dependent polyA sites. In human LGI4, polyA site choice is governed by alternative splicing. The 5′-most site is used in all tissues even as absolute expression levels fluctuate (see A for details). The intermediate site is used primarily in liver, while the downstream site is repressed in kidney, but is otherwise expressed at levels similar to the upstream site. (D) Number of polyA sites/3′UTR in five human tissues and UHR (navg/tissue = 16,387, ntotal uniq = 20,873; see Methods for 3′UTR compilation). All samples were normalized to equal numbers of aligned sequencing reads by random selection. (Black lines) Sites/3′UTR for aggregated data from these six samples. (E) Number of sequencing reads/site; sites were selected based on decreasing order of usage per 3′UTR. (F) Lineage-dependent polyadenylation of a pri-microRNA transcript. PolyA-seq detects polyadenylation downstream from the microRNA cluster containing let7a1, let7f1, and let7d in all tissues assayed in all species (data not shown, but see Supplemental Fig. 8 for additional details; for simplicity, PolyA-seq data and polyA signals are shown here only for human, rhesus, and mouse kidney, and only for the sense strand; arrows within microRNA precursors indicate the direction of transcription). In human and rhesus, two polyA sites (purple spikes) correspond to two canonical polyA signals (AATAAA; black tick marks), the first of which is present only in primate genomes (data not shown). In rat, mouse, and dog, only the downstream polyA site is detected, in accordance with the absence of the upstream polyA signal. (G) Distribution of reads and polyA sites across genomic features. All reads were aggregated in each species and then filtered and clustered as described in the main text.
Figure 4.
Figure 4.
Presence of the canonical polyadenylation sequence signal at filtered polyA sites. (A) The distribution of polyadenylation motif locations relative to polyA sites is enriched at a position 20–22 bp upstream of the polyA site, with a secondary peak at 10–11 bp. Positional frequencies of the 12 top-scoring hexamers (Table 2) are shown. The majority of sequences (98%) have either a perfect match or a site with a single mismatch to the canonical sequence. (B) Mean base content surrounding polyA sites computed at each base.
Figure 5.
Figure 5.
Evolutionary conservation of polyA site usage. (A) Nonhuman polyA sites were transferred to human coordinates (see Methods), combined with human polyA sites, and clustered. (B) 2D clustering of 2590 orthologous sites detected in at least one sample in each species based on polyA site usage/expression. PolyA site expression was normalized to Z-scores (standard deviations away from mean) within each sample. (C) 2D clustering of Pearson correlation coefficients between all pairwise sample combinations. Most samples exhibit higher correlation with cognate samples in other species than with samples in the same species (e.g., brain, liver, and testis). All clustering was performed hierarchically using Pearson correlation as a measure of distance and average linkage for grouping.

References

    1. Armour CD, Castle JC, Chen R, Babak T, Loerch P, Jackson S, Shah JK, Dey J, Rohl CA, Johnson JM, et al. 2009. Digital transcriptome profiling using selective hexamer priming for cDNA synthesis. Nat Methods 6: 647–649 - PubMed
    1. Asmann YW, Klee EW, Thompson EA, Perez EA, Middha S, Oberg AL, Therneau TM, Smith DI, Poland GA, Wieben ED, et al. 2009. 3′ tag digital gene expression profiling of human brain and universal reference RNA using Illumina Genome Analyzer. BMC Genomics 10: 531 doi: 10.1186/1471-2164-10-531 - PMC - PubMed
    1. Beaudoing E, Freier S, Wyatt JR, Claverie JM, Gautheret D 2000. Patterns of variant polyadenylation signal usage in human genes. Genome Res 10: 1001–1010 - PMC - PubMed
    1. Boguski MS, Lowe TM, Tolstoshev CM 1993. dbEST–database for “expressed sequence tags.” Nat Genet 4: 332–333 - PubMed
    1. Bullard JH, Purdom E, Hansen KD, Dudoit S 2010. Evaluation of statistical methods for normalization and differential expression in mRNA-Seq experiments. BMC Bioinformatics 11: 94 doi: 10.1186/1471-2105-11-94 - PMC - PubMed

Associated data