

Validity of triple- and dual-tracer techniques to estimate glucose appearance
- PMID: 22454288
- PMCID: PMC3378162
- DOI: 10.1152/ajpendo.00581.2011
Validity of triple- and dual-tracer techniques to estimate glucose appearance
Abstract
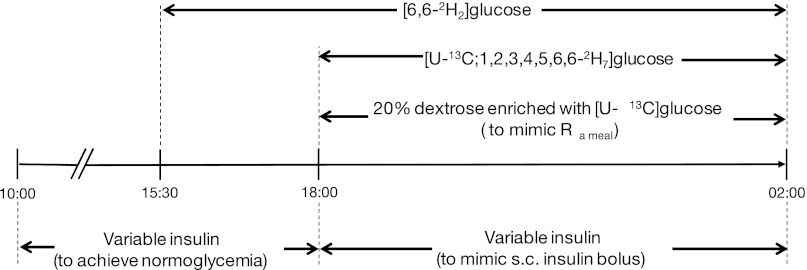
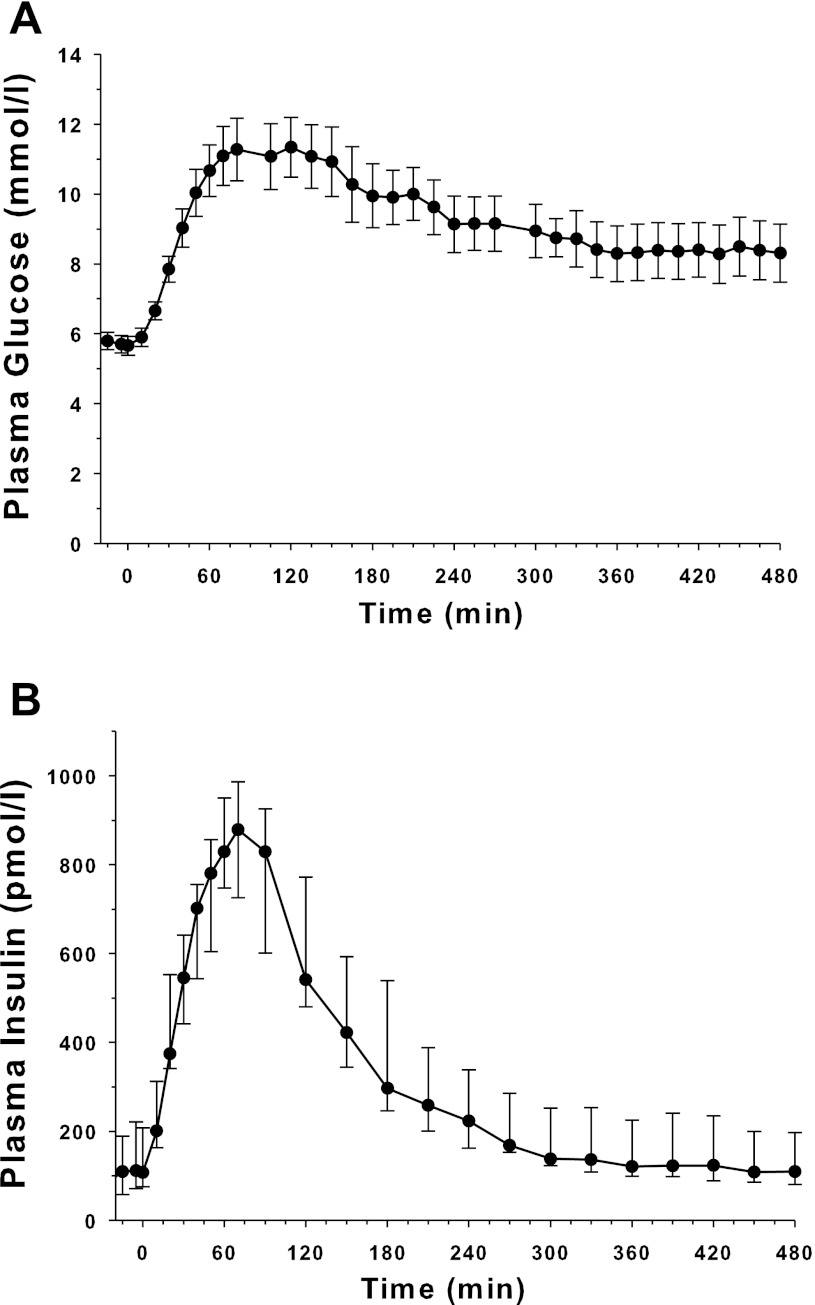
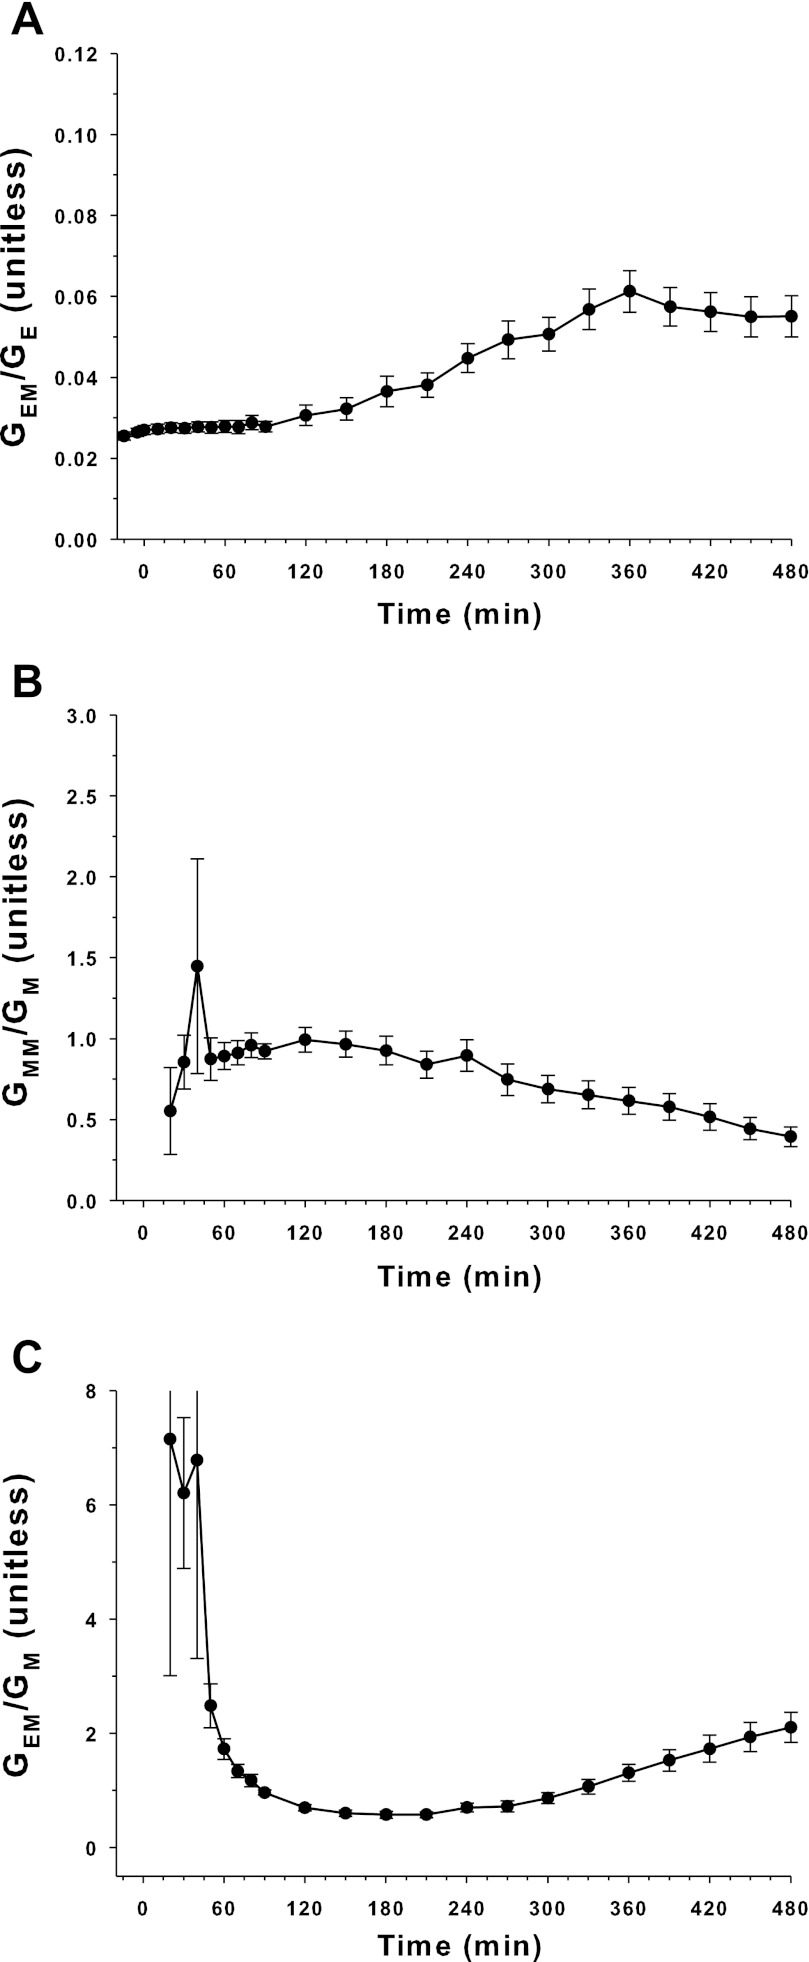
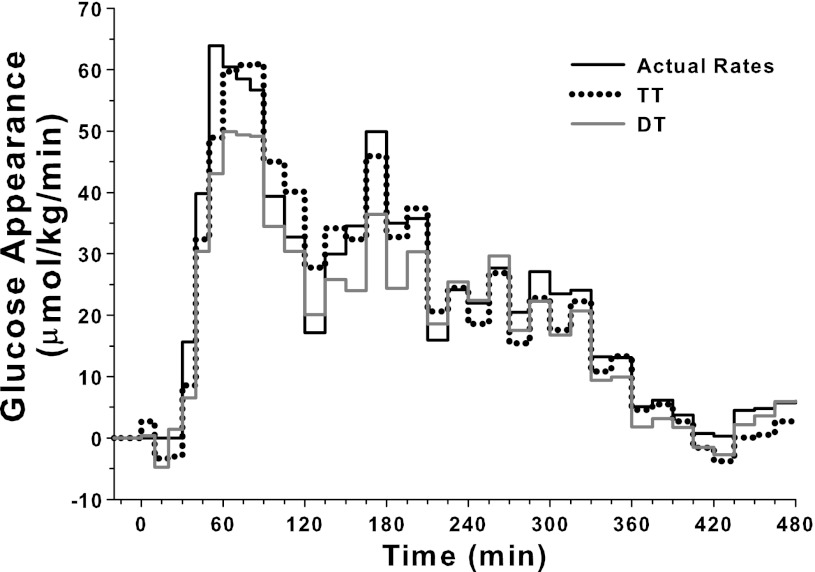
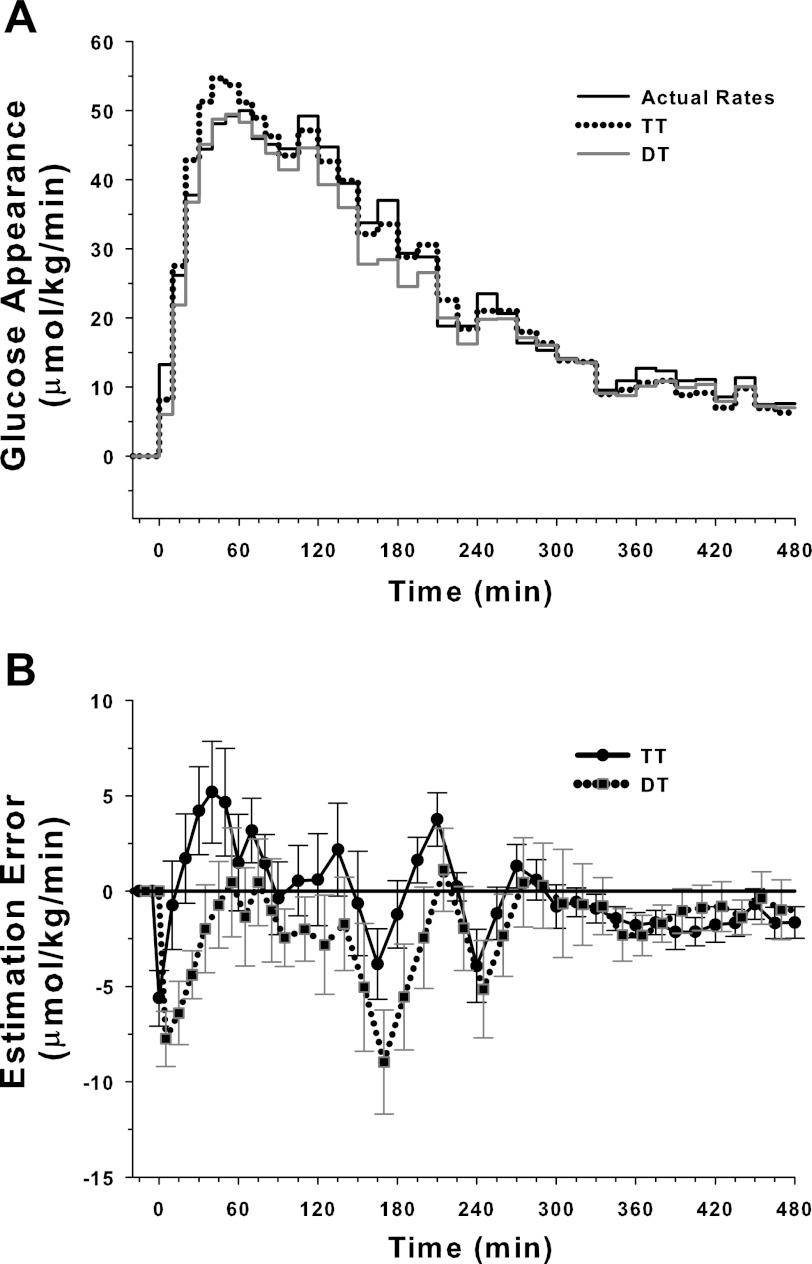
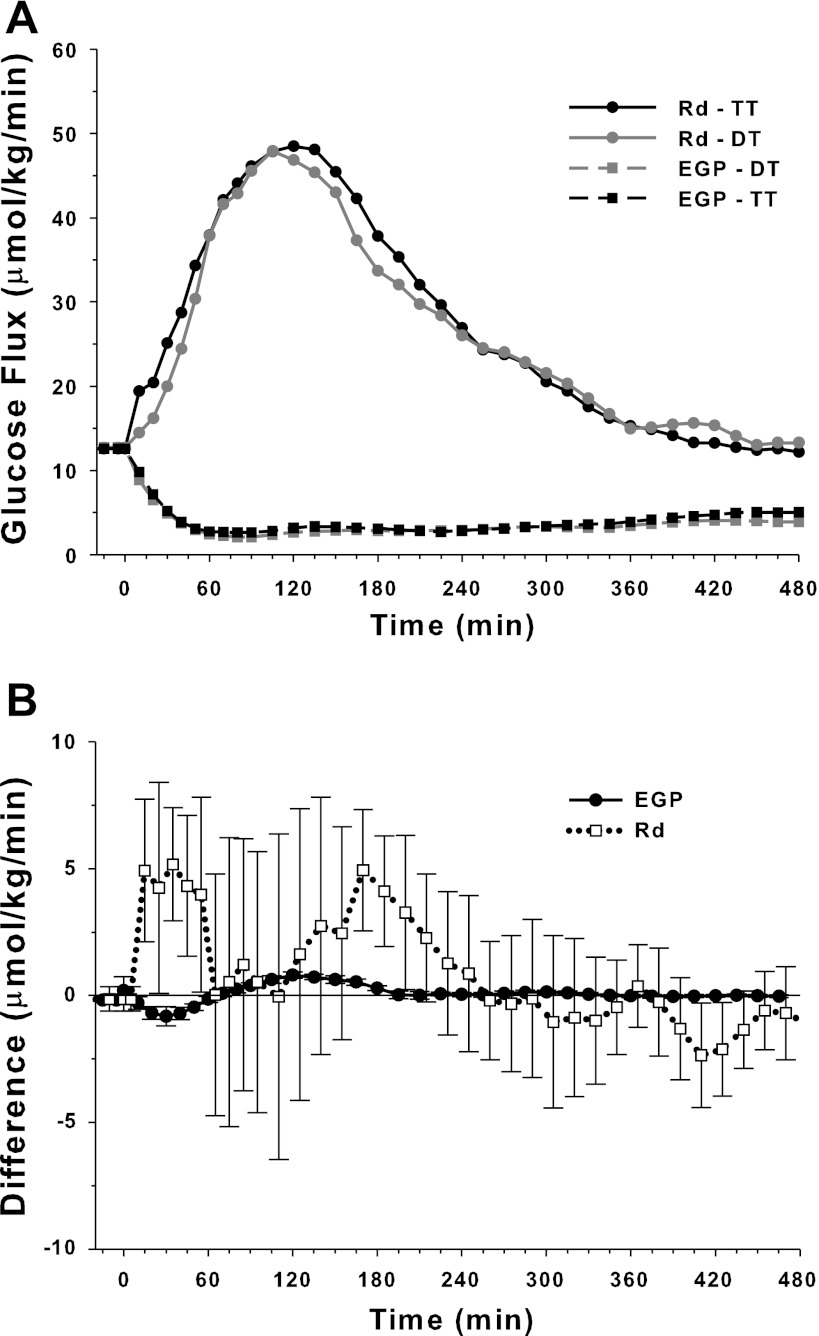
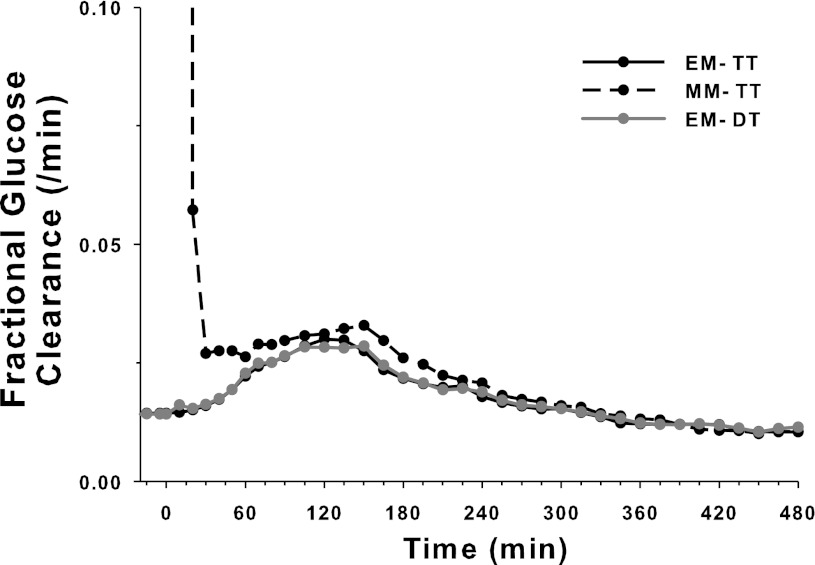
The triple-tracer (TT) dilution technique has been proposed to be the gold standard method to measure postprandial glucose appearance. However, validation against an independent standard has been missing. We addressed this issue and also validated the simpler dual-tracer (DT) technique. Sixteen young subjects with type 1 diabetes (age 19.5 ± 3.8 yr, BMI 23.4 ± 1.5 kg/m(2), HbA(1c) 8.7 ± 1.7%, diabetes duration 9.0 ± 6.9 yr, total daily insulin 0.9 ± 0.2 U·kg(-1)·day(-1), mean ± SD) received a variable intravenous 20% dextrose infusion enriched with [U-(13)C]glucose over 8 h to achieve postprandial-resembling glucose excursions while intravenous insulin was administered to achieve postprandial-resembling levels of plasma insulin. Primed [6,6-(2)H(2)]glucose was infused in a manner that mimicked the expected endogenous glucose production and [U-(13)C; 1,2,3,4,5,6,6-(2)H(7)]glucose was infused in a manner that mimicked the expected glucose appearance from a standard meal. Plasma glucose enrichment was measured by gas chromatography-mass spectrometry. The intravenous dextrose infusion served as an independent standard and was reconstructed using the TT and DT techniques with the two-compartment Radziuk/Mari model and an advanced stochastic computational method. The difference between the infused and reconstructed dextrose profile was similar for the two methods (root mean square error 6.6 ± 1.9 vs. 8.0 ± 3.5 μmol·kg(-1)·min(-1), TT vs. DT, P = NS, paired t-test). The TT technique was more accurate in recovering the overall dextrose infusion (100 ± 9 and 92 ± 12%; P = 0.02). The root mean square error associated with the mean dextrose infusion profile was 2.5 and 3.3 μmol·kg(-1)·min(-1) for the TT and DT techniques, respectively. We conclude that the TT and DT techniques combined with the advanced computational method can measure accurately exogenous glucose appearance. The TT technique tends to outperform slightly the DT technique, but the latter benefits from reduced experimental and computational complexity.
Figures
References
-
- Basu R, Di Camillo B, Toffolo G, Basu A, Shah P, Vella A, Rizza R, Cobelli C. Use of a novel triple-tracer approach to assess postprandial glucose metabolism. Am J Physiol Endocrinol Metab 284: E55–E69, 2003 - PubMed
-
- Chase HP, Saib SZ, MacKenzie T, Hansen MM, Garg SK. Post-prandial glucose excursions following four methods of bolus insulin administration in subjects with type 1 diabetes. Diabetic Med 19: 317–321, 2002 - PubMed
-
- Cobelli C, Mari A, Ferrannini E. Non-steady state: error analysis of Steele's model and developments for glucose kinetics. Am J Physiol Endocrinol Metab 252: E679–E689, 1987 - PubMed
-
- Congdon P. Bayesian Statistical Modelling. Chichester, UK; Hoboken, NJ: Wiley & Sons, 2006
Publication types
MeSH terms
Substances
Grants and funding
LinkOut - more resources
Full Text Sources
Other Literature Sources
Miscellaneous