. 2012 May;18(5):1029-40.
doi: 10.1261/rna.032243.112. Epub 2012 Mar 27.

Alternative splicing networks regulated by signaling in human T cells

Affiliations

Alternative splicing networks regulated by signaling in human T cells

Nicole M Martinez et al. RNA. 2012 May.

Abstract

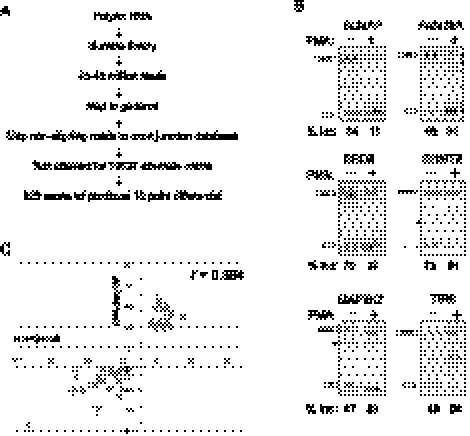
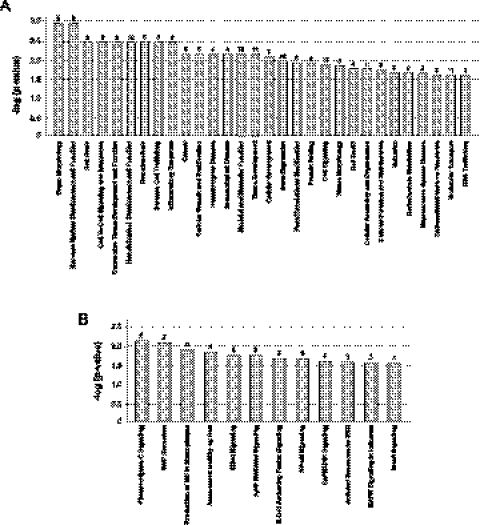
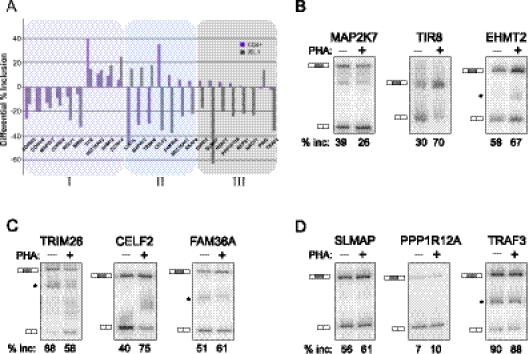
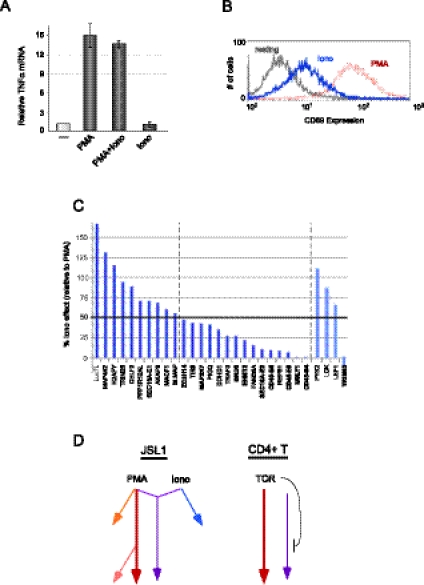
The formation and execution of a productive immune response requires the maturation of competent T cells and a robust change in cellular activity upon antigen challenge. Such changes in cellular function depend on regulated alterations to protein expression. Previous research has focused on defining transcriptional changes that regulate protein expression during T-cell maturation and antigen stimulation. Here, we globally analyze another critical process in gene regulation during T-cell stimulation, alternative splicing. Specifically, we use RNA-seq profiling to identify 178 exons in 168 genes that exhibit robust changes in inclusion in response to stimulation of a human T-cell line. Supporting an important role for the global coordination of alternative splicing following T-cell stimulation, these signal-responsive exons are significantly enriched in genes with functional annotations specifically related to immune response. The vast majority of these genes also exhibit differential alternative splicing between naive and activated primary T cells. Comparison of the responsiveness of splicing to various stimuli in the cultured and primary T cells further reveals at least three distinct networks of signal-induced alternative splicing events. Importantly, we find that each regulatory network is specifically associated with distinct sequence features, suggesting that they are controlled by independent regulatory mechanisms. These results thus provide a basis for elucidating mechanisms of signal pathway-specific regulation of alternative splicing during T-cell stimulation.


Figures

FIGURE 1.
FIGURE 1.
RNA-seq and RT-PCR validation of alternative splicing in resting and PMA-stimulated JSL1 cells. (A) Work flow of RNA-seq analysis of isoform expression in JSL1 cells. (B) Representative RT-PCR of genes newly predicted by RNA-seq analysis to exhibit differential isoform expression in resting (−PMA) versus stimulated (+PMA) JSL1 cells. The percent inclusion of the variable exon shown is an average of at least three independent experiments. (*) Nonreproducible cryptic splice products that are not included in our quantification. (C) Plot of differential in percent exon inclusion in resting versus stimulated cells as calculated by RNA-seq (y-axis) and RT-PCR (x-axis). The Pearson coefficient is calculated as 0.894.
FIGURE 2.
FIGURE 2.
Genes that undergo signal-responsive alternative splicing in JSL1 cells are enriched for activities required for T-cell function. (A) The 178 exons identified as signal-responsive in this study were analyzed by IPA (Ingenuity Systems; http://www.ingenuity.com) for functional categories. The categories graphed show above-threshold significance [−log(P-value) > 1.5] in enrichment relative to the 11,000 exons that were detectable in the RNA-seq analysis. The numbers above the bar graph represent the number of genes that score for each category. (B) Same as A, but genes were analyzed for their involvement in canonical signaling pathways.
FIGURE 3.
FIGURE 3.
Analysis of activation-induced splicing in CD4+ primary cells relative to JSL1 cells. (A) Graphical representation of the change in percent exon inclusion between resting and PHA-stimulated CD4+ cells (purple bars) compared with the change observed between resting and PMA-stimulated JSL1 cells (gray bars). The percent exon inclusion differential was calculated by RT-PCR and averaged from at least three independent donors (CD4+) and/or experiments (JSL1). Exons were further grouped in one of three categories: (I) responding similarly in both cell types (purple tint), (II) responding in an opposing manner in the two cell types (blue tint), or (III) showing no statistically significant change upon PHA treatment of CD4+ cells. See also Tables 1 and 2 for details. (B–D) Representative RT-PCR of isoform expression in resting (−PHA) versus stimulated (+PHA) CD4+ primary T cells, for genes in categories I (B), II (C), or III (D). The percent inclusion of variable exon shown is an average of at least three independent experiments.
FIGURE 4.
FIGURE 4.
Analysis of signaling pathways in JSL1 cells and their effect on alternative splicing. (A) Induction of TNF-α expression in response to PMA and/or ionomycin treatment of JSL1 cells. TNF-α mRNA was measured by RT-PCR, and the average of two experiments is shown. (B) Cell-surface expression of CD69, as measured by flow cytometry, in JSL1 cells grown under resting (gray), PMA stimulated (red), or ionomycin-stimulated (blue) conditions. (C) Analysis of ionomycin-induced alternative splicing of the top 25 PMA-responsive genes. Ionomycin responsiveness was quantified by RT-PCR from at least three independent experiments, and the difference in exon inclusion between resting and Ionomycin-stimulated cells was graphed as a percent of splicing change observed upon PMA stimulation (PMA differential set to 100%). (D) Model of signaling pathways in JSL1 versus CD4 cells as indicated by alternative splicing responsiveness.
FIGURE 5.
FIGURE 5.
Motif enrichment among signal-responsive alternative exons. (A) Logos of motif identified as enriched among category I exons and e-value of the enrichment (left) along with the location and P-value of the motif in each of the five exons in which it was identified (right). (B) Logos and corresponding e-values of the five motifs identified within the flanking introns of exons from categories I, II, and III, along with the names of the genes in which each motif is found. Detail of motifs and locations are provided in Supplemental Figure 1.

References

    1. Bailey TL, Boden M, Buske FA, Frith M, Grant CE, Clementi L, Ren J, Li WW, Noble WS 2009. MEME SUITE: Tools for motif discovery and searching. Nucleic Acids Res 37: W202–W208 - PMC - PubMed
    1. Beurel E, Michalek SM, Jope RS 2010. Innate and adaptive immune responses regulated by glycogen synthase kinase-3 (GSK3). Trends Immunol 31: 24–31 - PMC - PubMed
    1. Blencowe BJ, Ahmad S, Lee LJ 2009. Current-generation high-throughput sequencing: Deepening insights into mammalian transcriptomes. Genes Dev 23: 1379–1386 - PubMed
    1. Chen M, Manley JL 2009. Mechanisms of alternative splicing regulation: Insights from molecular and genomics approaches. Natl Rev 10: 741–754 - PMC - PubMed
    1. Clower CV, Chatterjee D, Wang Z, Cantley LC, Vander Heiden MG, Krainer AR 2010. The alternative splicing repressors hnRNP A1/A2 and PTB influence pyruvate kinase isoform expression and cell metabolism. Proc Natl Acad Sci 107: 1894–1899 - PMC - PubMed

Publication types

Associated data