. 2012 May;11(5):202-14.
doi: 10.1074/mcp.M112.017707. Epub 2012 Mar 26.

Platform-independent and label-free quantitation of proteomic data using MS1 extracted ion chromatograms in skyline: application to protein acetylation and phosphorylation

Affiliations

Platform-independent and label-free quantitation of proteomic data using MS1 extracted ion chromatograms in skyline: application to protein acetylation and phosphorylation

Birgit Schilling et al. Mol Cell Proteomics. 2012 May.

Abstract

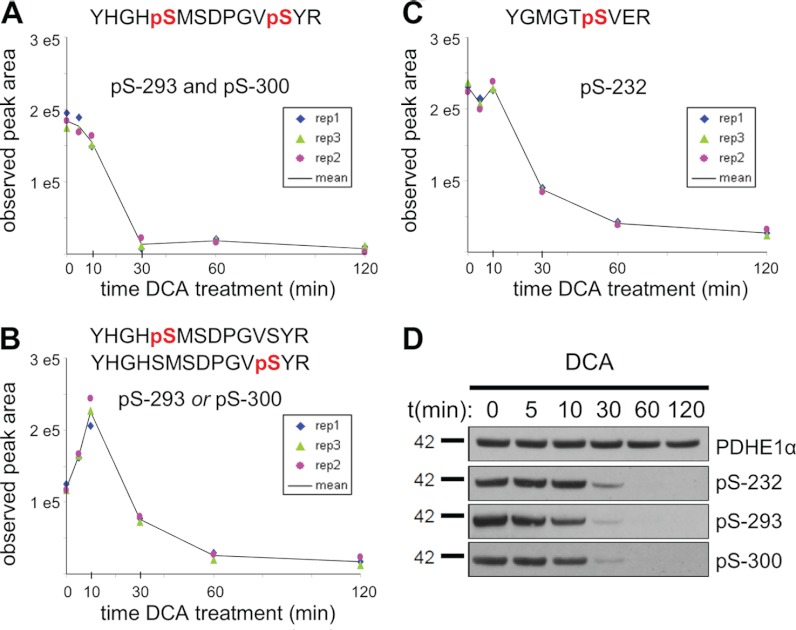
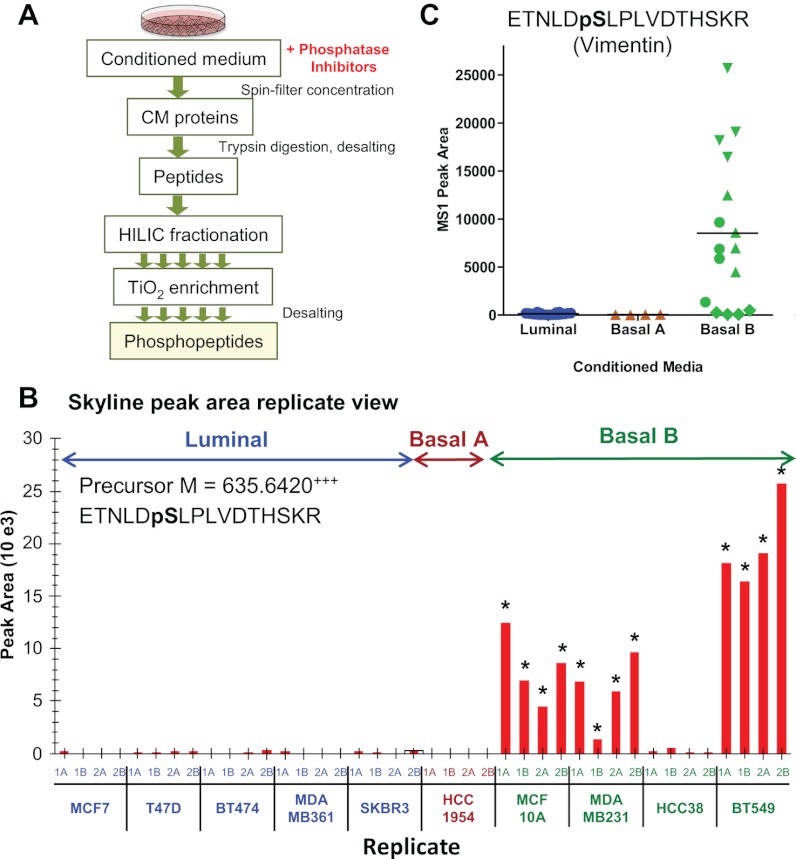
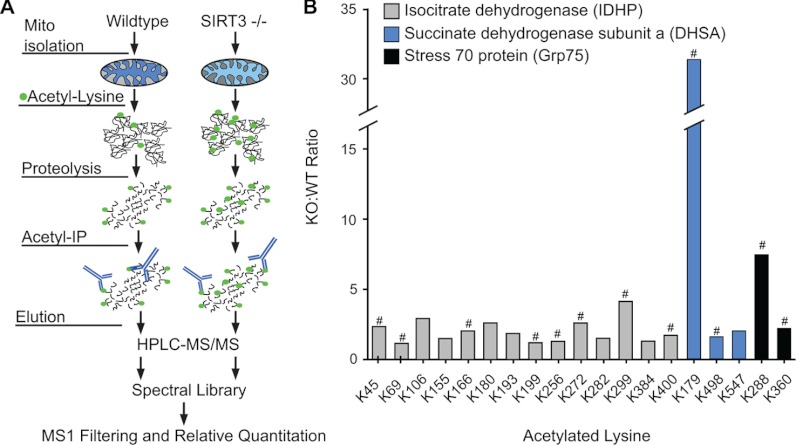
Despite advances in metabolic and postmetabolic labeling methods for quantitative proteomics, there remains a need for improved label-free approaches. This need is particularly pressing for workflows that incorporate affinity enrichment at the peptide level, where isobaric chemical labels such as isobaric tags for relative and absolute quantitation and tandem mass tags may prove problematic or where stable isotope labeling with amino acids in cell culture labeling cannot be readily applied. Skyline is a freely available, open source software tool for quantitative data processing and proteomic analysis. We expanded the capabilities of Skyline to process ion intensity chromatograms of peptide analytes from full scan mass spectral data (MS1) acquired during HPLC MS/MS proteomic experiments. Moreover, unlike existing programs, Skyline MS1 filtering can be used with mass spectrometers from four major vendors, which allows results to be compared directly across laboratories. The new quantitative and graphical tools now available in Skyline specifically support interrogation of multiple acquisitions for MS1 filtering, including visual inspection of peak picking and both automated and manual integration, key features often lacking in existing software. In addition, Skyline MS1 filtering displays retention time indicators from underlying MS/MS data contained within the spectral library to ensure proper peak selection. The modular structure of Skyline also provides well defined, customizable data reports and thus allows users to directly connect to existing statistical programs for post hoc data analysis. To demonstrate the utility of the MS1 filtering approach, we have carried out experiments on several MS platforms and have specifically examined the performance of this method to quantify two important post-translational modifications: acetylation and phosphorylation, in peptide-centric affinity workflows of increasing complexity using mouse and human models.


Figures

Fig. 1.
Fig. 1.
Schematic of MS1 filtering. A, heat map of MS1 signal across the chromatographic gradient for the entire m/z range as acquired on a high resolution mass spectrometer. B, “zoom-in” display of an isotopic envelope for the molecular ion of a typical peptide with peaks at M, M + 1, and M + 2 selected showing changes in MS1 intensity over time. C, high resolution data allow specific filtering of molecular ions and separation of individual peaks within the isotope distribution. Skyline sums intensities within a single resolution to either side of the predicted mass to charge ratio allowing for a filter window of twice the theoretical resolution, predicted full width at half-maximum (2×FWHM). The resolution setting can be selected by the user depending on MS instrument type and preferred isotope m/z acquisition range.
Fig. 2.
Fig. 2.
Schematic of MS1 filtering proteomic data flow. New or significantly revised modules unique to Skyline MS1 filtering are indicated in text boxes (see text for explanation).
Fig. 3.
Fig. 3.
Skyline MS1 filtering graphical user interface. A, Skyline peptide tree for peptide YAPVAKacDLASR (Kac is acetyllysine, and R is 13C615N4-Arg) showing three extracted molecular ion isotope peaks M, M + 1, and M + 2. B, chromatograms and peak intensity traces for four acquisitions from two samples run in duplicates with heavy peptides spiked at 1 and 3 fmol (S1R1, S1R2, S2R1, and S2R2, respectively). The vertical lines with annotated retention times and identification (ID) mark underlying MS/MS sampling that initially directed MS1 peak picking. C, Skyline displays a library of MS/MS spectra for the selected peptide that provides underlying peptide identification information for a specific acquisition replicate. In this case, the underlying MS/MS spectra for two of the four replicates, S1R1 and S2R2 are shown, although all spectra can be displayed. D and E, established Skyline visual displays previously developed for targeted LC-MRM data processing, include peak area replicate views (D) and retention time replicates (E) (further details on Skyline graphical displays, settings, and parameters see supplemental Figs. S1–S3).
Fig. 4.
Fig. 4.
Standard concentration curves for stable isotope-labeled and acetyllysine containing peptides. A and B, YAPVAKacDLASR (A, succinate dehydrogenase complex, subunit A) and LVSSVSDLPKacR (B, 3-hydroxy-3-methylglutaryl-CoA synthase 2) spanning a concentration range from 4 attomoles to 25 femtomoles. Peptides were diluted into either a simple matrix (red triangles, 25 fmol “six protein mix”) or a complex matrix (blue circles, mitochondrial lysate from mouse liver, 0.3 μg on column), and acquired on a TripleTOF 5600 mass spectrometer in triplicates. MS1 filtered peak area curves for precursor ions M with m/z 621.83952+ (A, heavy YAPVAKacDLASR) and m/z 626.86042+ (B, heavy LVSSVSDLPKacR). Weighted regression lines and calculated LOQ are indicated (also see supplemental Table S3), and weighted linear regression slopes were determined as 1.03 and 1.03 for YAP and 0.99 and 1.00 for LVS peptides in the different matrices. C, peak area CVs across three replicates for each concentration point (0.037–25 fmol) in complex matrix are shown for six targeted acetyllysine peptides with 20 and 30% CV cutoffs indicated (also see supplemental Figs. S6, C and F). D, high throughput analysis showing peak area CVs for 366 peptides across 27 independently acquired runs in a complex mitochondrial lysate background matrix. Peak area CVs are displayed against MS1 filtered precursor m/z.
Fig. 5.
Fig. 5.
Time course of phosphorylation changes at Ser-293, Ser-300, and Ser-232 in PDHE1α following kinase inhibition with DCA. A, relative quantitation over three injection replicates for diphosphopeptide, YHGHpS293MSDPGVpS300YR, with precursor ion M extracted at m/z 876.8155. B, relative quantitation for the corresponding phosphopeptides, YHGHpS293MSDPGVSYR and/or YHGHSMSDPGVpS300YR, with precursor ion M extracted at m/z 836.8323. C, phosphopeptide YGMGTpS232VER with precursor ion M extracted at m/z 540.2150. D, independent Western blot analysis of PDHE1α phosphorylation with phosphosite-specific and total protein antibodies in response to DCA treatment.
Fig. 6.
Fig. 6.
Relative quantitation of phosphopeptides from conditioned media from subtype specific breast cancer cell lines. A, workflow for phosphopeptide enrichment from CM, including hydrophilic interaction liquid chromatography separation steps prior to TiO2 phosphopeptide enrichment and subsequent LC-MS/MS analysis. B, Skyline peak area replicate view of phosphopeptide, ETNLDpSLPLVDTHSKR, derived from vimentin and extracted by precursor ion M at m/z 635.642. The peak was monitored for CM from five luminal, one basal A, and four basal B cancer cell lines (two biological and two injection replicates each) with measured peak area means at 126, 33, and 8538, respectively. The asterisks at individual replicates indicate sampling of an MS/MS and identification of the phosphopeptide. C, plot of MS1 filtered peak areas clustered by breast cancer subtype, with blue for luminal, brown for basal A, and green for basal B CM samples (two biological and two acquisition replicates per individual cell line maintain the same symbol).
Fig. 7.
Fig. 7.
Monitoring the acetylation profile of mitochondrial proteins in SIRT3 KO mice. A, schematic of workflow for acetylpeptide enrichment from skeletal muscle mitochondria from WT and SIRT3 KO animals, including anti-acetyllysine enrichment of Lys-acetylated peptides, LC-MS/MS of two injection replicates, and generation of a spectral library in Skyline for MS1 filtering and relative quantitation. B, ratio (KO:WT) of peak area intensities for individual tryptic acetyllysine peptides at different sites across three proteins from skeletal muscle samples for four WT and four SIRT3 KO mice. # indicates significance: p < 0.05 by two-tailed Student's t test; n = 4 for WT and SIRT3−/− (KO) with two injection replicates per sample.

Similar articles

Cited by

References

    1. Bantscheff M., Schirle M., Sweetman G., Rick J., Kuster B. (2007) Quantitative mass spectrometry in proteomics: a critical review. Anal. Bioanal. Chem. 389, 1017–1031 - PubMed
    1. Mueller L. N., Brusniak M. Y., Mani D. R., Aebersold R. (2008) An assessment of software solutions for the analysis of mass spectrometry based quantitative proteomics data. J. Proteome Res. 7, 51–61 - PubMed
    1. Ong S. E., Blagoev B., Kratchmarova I., Kristensen D. B., Steen H., Pandey A., Mann M. (2002) Stable isotope labeling by amino acids in cell culture, SILAC, as a simple and accurate approach to expression proteomics. Mol. Cell. Proteomics 1, 376–386 - PubMed
    1. Krüger M., Moser M., Ussar S., Thievessen I., Luber C. A., Forner F., Schmidt S., Zanivan S., Fässler R., Mann M. (2008) SILAC mouse for quantitative proteomics uncovers kindlin-3 as an essential factor for red blood cell function. Cell 134, 353–364 - PubMed
    1. Zanivan S., Krueger M., Mann M. (2012) In vivo quantitative proteomics: The SILAC mouse. Methods Mol. Biol. 757, 435–450 - PubMed

Publication types

MeSH terms

LinkOut - more resources