. 2012 Aug;11(8):286-302.
doi: 10.1074/mcp.M111.016790. Epub 2012 Mar 27.

Proteomic cornerstones of hematopoietic stem cell differentiation: distinct signatures of multipotent progenitors and myeloid committed cells

Affiliations

Proteomic cornerstones of hematopoietic stem cell differentiation: distinct signatures of multipotent progenitors and myeloid committed cells

Daniel Klimmeck et al. Mol Cell Proteomics. 2012 Aug.

Abstract

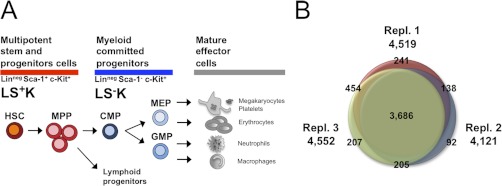
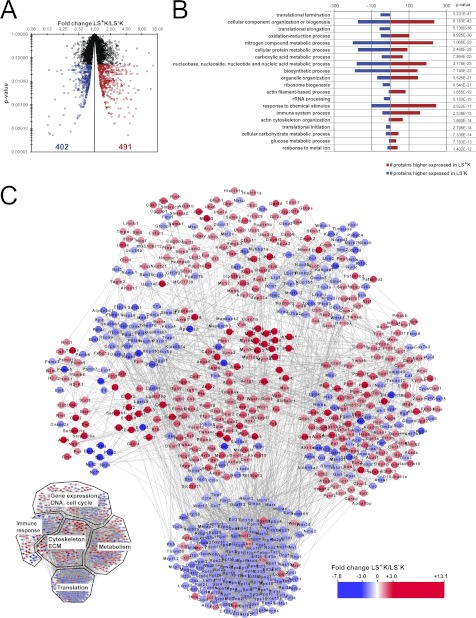
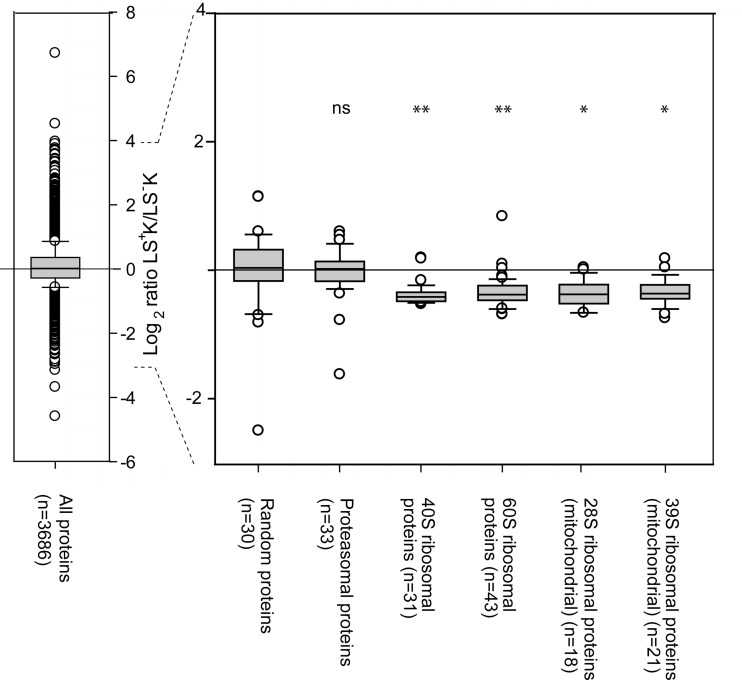
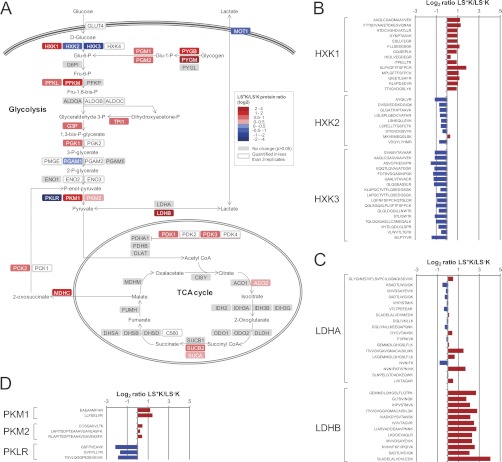
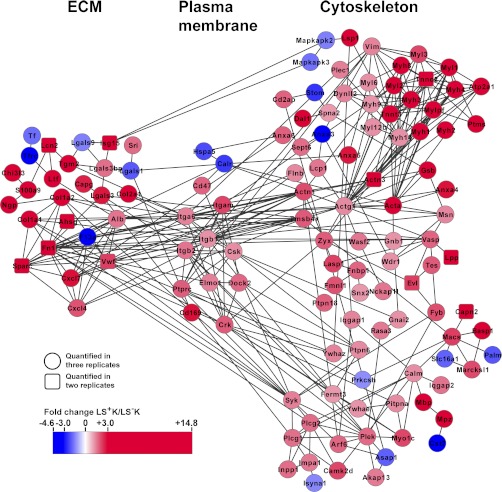
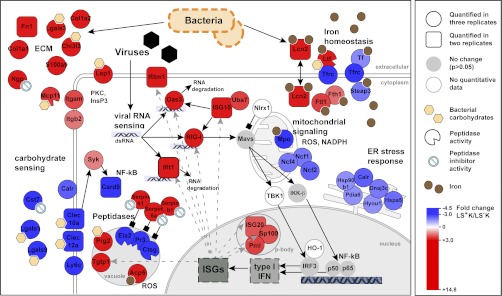
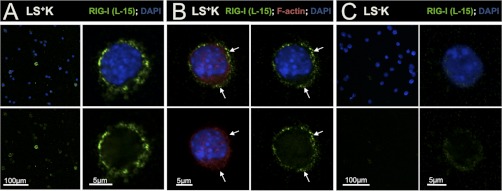
Regenerative tissues such as the skin epidermis, the intestinal mucosa or the hematopoietic system are organized in a hierarchical manner with stem cells building the top of this hierarchy. Somatic stem cells harbor the highest self-renewal activity and generate a series of multipotent progenitors which differentiate into lineage committed progenitors and subsequently mature cells. In this report, we applied an in-depth quantitative proteomic approach to analyze and compare the full proteomes of ex vivo isolated and FACS-sorted populations highly enriched for either multipotent hematopoietic stem/progenitor cells (HSPCs, Lin(neg)Sca-1(+)c-Kit(+)) or myeloid committed precursors (Lin(neg)Sca-1(-)c-Kit(+)). By employing stable isotope dimethyl labeling and high-resolution mass spectrometry, more than 5000 proteins were quantified. From biological triplicate experiments subjected to rigorous statistical evaluation, 893 proteins were found differentially expressed between multipotent and myeloid committed cells. The differential protein content in these cell populations points to a distinct structural organization of the cytoskeleton including remodeling activity. In addition, we found a marked difference in the expression of metabolic enzymes, including a clear shift of specific protein isoforms of the glycolytic pathway. Proteins involved in translation showed a collective higher expression in myeloid progenitors, indicating an increased translational activity. Strikingly, the data uncover a unique signature related to immune defense mechanisms, centering on the RIG-I and type-1 interferon response systems, which are installed in multipotent progenitors but not evident in myeloid committed cells. This suggests that specific, and so far unrecognized, mechanisms protect these immature cells before they mature. In conclusion, this study indicates that the transition of hematopoietic stem/progenitors toward myeloid commitment is accompanied by a profound change in processing of cellular resources, adding novel insights into the molecular mechanisms at the interface between multipotency and lineage commitment.


Figures

Fig. 1.
Fig. 1.
Quantitative proteomic analysis of hematopoietic stem and progenitor cells. A, Early hematopoiesis. Multipotent hematopoietic stem cells (HSCs) give rise to multipotent progenitors (MPPs), which commit either to myeloid specified progenitors (CMP; common myeloid progenitors; GMPs: granulocyte-macrophage progenitors, and MEPs: megakaryocyte/erythrocyte progenitors) or to lymphoid specified progenitors with limited cell fate. Cell fractions can be highly purified by FACS using specific surface markers for Lineage (Lin), Sca-1, and c-Kit, distinguishing multipotent progenitor cells (LS+K) from myeloid committed (LSK) cells. B, Overlap of quantified proteins in three biological replicates. The Venn diagram displays number of proteins quantified in each of the three replicates and their overlap. In total 5023 proteins were quantified.
Fig. 2.
Fig. 2.
Differential protein expression between multipotent and myeloid committed progenitors. A, Significantly changed proteins. After statistical test and correction of p value for multiple testing, 893 proteins showed a significant (p < 0.05) change of expression in the LS+K to LSK transition. 491 proteins were higher expressed in LS+K cells, and 402 proteins were higher expressed in LSK cells. B, Enriched biological processes of differentially expressed proteins. Significantly changed proteins were mapped onto biological processes according to Gene Ontology classification system. The presented biological processes are sorted according to the p value. To show diverse processes enriched in the data, redundant or highly similar terms were removed. Within each biological process, number of proteins with a higher expression in LS+K (red) and LSK (blue) are shown. C, Protein-protein interaction network of differentially expressed proteins. An interaction network was built based on the 893 significantly differentially expressed proteins (p < 0.05) using STRING. Proteins higher expressed in LS+K cells are shown in red and proteins higher expressed in LSK cells are shown in blue.
Fig. 3.
Fig. 3.
Ribosomal complexes show reduced expression in the LS+K to LSK transition compared with the overall data set. Box plots show ratio distribution for all proteins quantified in three replicates (n = 3686), a random set of 30 proteins (to show a similar-sized group of proteins as the ribosomal and proteasomal proteins), all quantified proteasomal proteins (n = 33), all quantified 40S ribosomal proteins (n = 31), all quantified 60S ribosomal proteins (n = 43), all quantified 28S mitochondrial ribosomal proteins (n = 18), and all quantified 39S mitochondrial ribosomal proteins (n = 21). Student's t test was performed to evaluate if the protein ratios of the groups of proteasomal and ribosomal proteins were significantly different from the the 30 random proteins. * p < 0.05; ** p < 0.005; ns = not significant (p > 0.05).
Fig. 4.
Fig. 4.
A, Differential expression of proteins involved in glycolysis and TCA cycle. A pathway map was built based on Metacore GeneGO pathway maps of glycolysis and glyconeogenesis. Proteins higher expressed in LS+K cells are shown in red and proteins higher expressed in LSK cells are shown in blue. Quantified but not significantly differentially expressed proteins (p > 0.05) are shown in gray. B, Peptide ratios for unique peptides of isoforms of hexokinase. Average values from two or three replicates are shown. C, Peptide ratios for unique peptides of subunits of lactate dehydrogenase. Average values from two or three replicates are shown. D, Peptide ratios for unique peptides of isoforms of pyruvate kinase. Average values from two or three replicates are shown.
Fig. 5.
Fig. 5.
Differential expression of cytoskeletal and extracellular matrix proteins. An interaction network was built based on differentially expressed proteins (p < 0.05) of cytoskeleton and extracellular matrix (according to GO-classification) using STRING. Based on proteins quantified in three replicates (circular nodes), highly related proteins quantified in two replicates were implemented (square nodes). Proteins higher expressed in LS+K cells are shown in red and proteins higher expressed in LSK cells are shown in blue.
Fig. 6.
Fig. 6.
Differential expression of proteins involved in innate immune response. The illustration depicts self-protective mechanisms of multipotent and myeloid committed progenitors. Proteins were grouped according to GO-classification and literature (see main text). Proteins higher expressed in LS+K cells are shown in red and proteins higher expressed in LSK cells are shown in blue.
Fig. 7.
Fig. 7.
RIG-I is differentially expressed between multipotent and myeloid committed progenitors. A, Expression and subcellular localization of the viral nucleic acid sensor RIG-I was examined on cytospins of LS+K. B, Costaining of RIG-I with F-actin (phalloidin) on LS+K cells revealed a distinct, non-matching localization of RIG-I more peripheral than F-actin. C, Expression and subcellular localization of RIG-I on cytospins of LSK cells.

References

    1. Till J. E., McCulloch C. E. (1961) A direct measurement of the radiation sensitivity of normal mouse bone marrow cells. Radiation Res. 14, 213–222 - PubMed
    1. Purton L. E., Scadden D. T. (2007) Limiting factors in murine hematopoietic stem cell assays. Cell Stem Cell 1, 263–270 - PubMed
    1. Wilson A., Oser G. M., Jaworski M., Blanco-Bose W. E., Laurenti E., Adolphe C., Essers M. A., Macdonald H. R., Trumpp A. (2007) Dormant and self-renewing hematopoietic stem cells and their niches. Ann. NY Acad. Sci. 1106, 64–75 - PubMed
    1. Weissman I. L., Shizuru J. A. (2008) The origins of the identification and isolation of hematopoietic stem cells, and their capability to induce donor-specific transplantation tolerance and treat autoimmune diseases. Blood 112, 3543–3553 - PMC - PubMed
    1. Trumpp A., Essers M., Wilson A. (2010) Awakening dormant haematopoietic stem cells. Nature Rev. Immunol. 10, 201–209 - PubMed

Publication types