. 2009;9(8):6131-49.
doi: 10.3390/s90806131. Epub 2009 Aug 3.

Calibration of correlation radiometers using pseudo-random noise signals

Affiliations

Calibration of correlation radiometers using pseudo-random noise signals

Isaac Ramos Pérez et al. Sensors (Basel). 2009.

Abstract

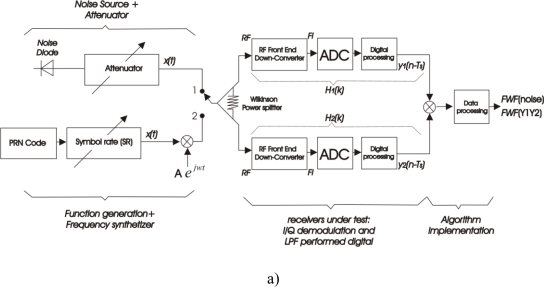
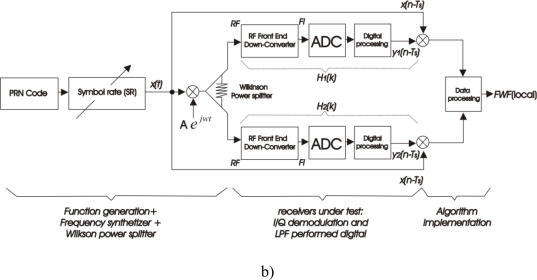
The calibration of correlation radiometers, and particularly aperture synthesis interferometric radiometers, is a critical issue to ensure their performance. Current calibration techniques are based on the measurement of the cross-correlation of receivers' outputs when injecting noise from a common noise source requiring a very stable distribution network. For large interferometric radiometers this centralized noise injection approach is very complex from the point of view of mass, volume and phase/amplitude equalization. Distributed noise injection techniques have been proposed as a feasible alternative, but are unable to correct for the so-called "baseline errors" associated with the particular pair of receivers forming the baseline. In this work it is proposed the use of centralized Pseudo-Random Noise (PRN) signals to calibrate correlation radiometers. PRNs are sequences of symbols with a long repetition period that have a flat spectrum over a bandwidth which is determined by the symbol rate. Since their spectrum resembles that of thermal noise, they can be used to calibrate correlation radiometers. At the same time, since these sequences are deterministic, new calibration schemes can be envisaged, such as the correlation of each receiver's output with a baseband local replica of the PRN sequence, as well as new distribution schemes of calibration signals. This work analyzes the general requirements and performance of using PRN sequences for the calibration of microwave correlation radiometers, and particularizes the study to a potential implementation in a large aperture synthesis radiometer using an optical distribution network.

Keywords: PRN; Pseudo-Random Noise; calibration; correlation radiometers.


Figures

Figure 1.
Figure 1.
Block diagrams of the calibration approaches. a) FWF(noise) with the switch in position 1 and FWF(Y1·Y2) with the switch in position 2. b) FWF(local).
Figure 1.
Figure 1.
Block diagrams of the calibration approaches. a) FWF(noise) with the switch in position 1 and FWF(Y1·Y2) with the switch in position 2. b) FWF(local).
Figure 2.
Figure 2.
Equivalent low-pass spectrum of PRN sequence (black) with different Symbol Rates (SR) and H(f) estimated from noise (gray). Positive and negative frequencies plotted normalized to the bandwidth.
Figure 3.
Figure 3.
FWF estimated by cross-correlating receivers’ outputs at different time lags when injecting thermal noise at different equivalent noise temperatures TN [K].
Figure 4.
Figure 4.
a) FWF estimated by cross-correlating receivers’ outputs when calibration signal is a PRN sequence FWF(Y1·Y2) (Equations 1–2) and comparison with reference FWF computed with correlated noise with TN= 1500 K (Figure 3). b) FWF estimated by cross-correlating receivers’ output with local replica of PRN sequence FWF(local) (Equations 3–7) and comparison with reference FWF computed with correlated noise with TN= 1500 K (Figure 3). Note: time axis is normalized to 1/B.
Figure 5.
Figure 5.
a) FWF estimated by cross-correlating receivers’ output with local replica of PRN sequence FWF(local) (Equation 3–7) for different input powers and comparison with reference FWF computed with correlated noise with TN= 1500 K (Figure 3). b) FWF estimated by cross-correlating receivers’ outputs when calibration signal is a PRN sequence FWF(Y1·Y2) (Equation 1–2) for different input powers and comparison with reference FWF computed with correlated noise with TN= 1500 K (Figure 3). Note: time axis normalized to 1/B.
Figure 5.
Figure 5.
a) FWF estimated by cross-correlating receivers’ output with local replica of PRN sequence FWF(local) (Equation 3–7) for different input powers and comparison with reference FWF computed with correlated noise with TN= 1500 K (Figure 3). b) FWF estimated by cross-correlating receivers’ outputs when calibration signal is a PRN sequence FWF(Y1·Y2) (Equation 1–2) for different input powers and comparison with reference FWF computed with correlated noise with TN= 1500 K (Figure 3). Note: time axis normalized to 1/B.
Figure 6.
Figure 6.
a) FWF amplitude and phase errors at τ = 0, ± Ts when FWF is estimated by cross-correlating receivers’ output with local replica of PRN sequence FWF(local) (Equations 3–7) for different input powers. b) FWF amplitude and phase errors at τ = 0, ± Ts when FWF is estimated by cross-correlating receivers’ outputs when calibration signal is a PRN sequence FWF(Y1·Y2) (Equations 1–2) for different input powers.
Figure 6.
Figure 6.
a) FWF amplitude and phase errors at τ = 0, ± Ts when FWF is estimated by cross-correlating receivers’ output with local replica of PRN sequence FWF(local) (Equations 3–7) for different input powers. b) FWF amplitude and phase errors at τ = 0, ± Ts when FWF is estimated by cross-correlating receivers’ outputs when calibration signal is a PRN sequence FWF(Y1·Y2) (Equations 1–2) for different input powers.
Figure 7.
Figure 7.
a) FWF estimated by cross-correlating receivers’ output with local replica of PRN sequence FWF(local) (Equations 3–7) for different number of quantization bits and comparison with reference FWF computed with correlated noise with TN = 1500 K (Figure 3). b) FWF estimated by cross-correlating receivers’ outputs when calibration signal is a PRN sequence FWF(Y1·Y2) (Equations 1–2) for different number of quantization bits and comparison with reference FWF computed with correlated noise with TN = 1500 K (Figure 3).
Figure 7.
Figure 7.
a) FWF estimated by cross-correlating receivers’ output with local replica of PRN sequence FWF(local) (Equations 3–7) for different number of quantization bits and comparison with reference FWF computed with correlated noise with TN = 1500 K (Figure 3). b) FWF estimated by cross-correlating receivers’ outputs when calibration signal is a PRN sequence FWF(Y1·Y2) (Equations 1–2) for different number of quantization bits and comparison with reference FWF computed with correlated noise with TN = 1500 K (Figure 3).
Figure 8.
Figure 8.
a) FWF amplitude and phase errors at τ = 0, ± Ts as a function of the quantization bits when FWF is estimated by cross-correlating receivers’ output with local replica of PRN sequence FWF(local) (Equation 3–7), b) FWF amplitude and phase errors at τ = 0, ± Ts as a function of the quantization bits when FWF is estimated by cross-correlating receivers’ outputs when calibration signal is a PRN sequence FWF(Y1·Y2) (Equations 1–2).
Figure 8.
Figure 8.
a) FWF amplitude and phase errors at τ = 0, ± Ts as a function of the quantization bits when FWF is estimated by cross-correlating receivers’ output with local replica of PRN sequence FWF(local) (Equation 3–7), b) FWF amplitude and phase errors at τ = 0, ± Ts as a function of the quantization bits when FWF is estimated by cross-correlating receivers’ outputs when calibration signal is a PRN sequence FWF(Y1·Y2) (Equations 1–2).
Figure 9.
Figure 9.
Concept block diagram of the implementation network in fibre optics [21].

References

    1. Thompson A.R., Moran J.M., Swenson G.W., Jr. Interferometry and Synthesis in Radio Astronomy. 2nd ed. Wiley; New York, NY, USA: 2001.
    1. Camps A., Torres F., Lopez-Dekker P., Frasier S.J. Redundant space calibration of hexagonal and Y-shaped beamforming radars and interferometric radiometers. Int. J. Remote Sens. 2003;24:5183–5196.
    1. SMOS: ESA’s Water Mission. ESA Publications Division; Noordwijk, The Netherlands: Brochure BR-224; [Online] June 2004. Available at: http://www.esa.int/esapub/br/br224/br224.pdf.
    1. Torres F., Camps A., Bará J., Corbella I, Ferrero R. On-board phase and modulus calibration of large aperture synthesis radiometers: Study applied to MIRAS. IEEE T. Geosci. Remote. 1996;4:1000–1009.
    1. Tanner A.B., Wilson W.J., Kangaslahti P.P., Lambrigsten B.H., Dinardo S.J., Piepmeier J.R., Ruf C.S., Rogacki S., Gross S.M., Musko S. Prototype development of a geostationary synthetic thinned aperture radiometer (GeoSTAR). 2004 IEEE International Geoscience and Remote Sensing Symposium; Long Beach, CA, USA. September 20–24, 2005; pp. 2075–2078.

LinkOut - more resources