

Lifestyle change and mobility in obese adults with type 2 diabetes
- PMID: 22455415
- PMCID: PMC3339039
- DOI: 10.1056/NEJMoa1110294
Lifestyle change and mobility in obese adults with type 2 diabetes
Abstract
Background: Adults with type 2 diabetes mellitus often have limitations in mobility that increase with age. An intensive lifestyle intervention that produces weight loss and improves fitness could slow the loss of mobility in such patients.
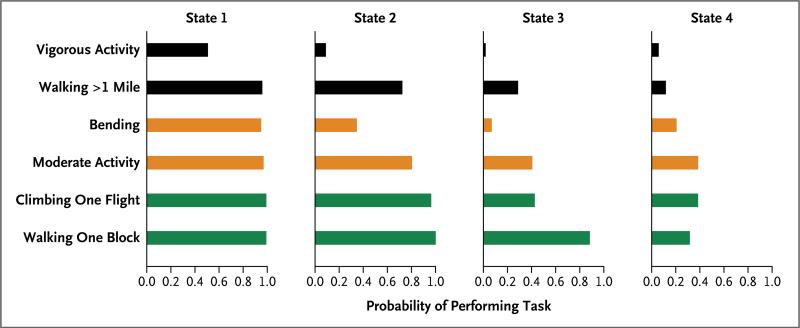
Methods: We randomly assigned 5145 overweight or obese adults between the ages of 45 and 74 years with type 2 diabetes to either an intensive lifestyle intervention or a diabetes support-and-education program; 5016 participants contributed data. We used hidden Markov models to characterize disability states and mixed-effects ordinal logistic regression to estimate the probability of functional decline. The primary outcome was self-reported limitation in mobility, with annual assessments for 4 years.
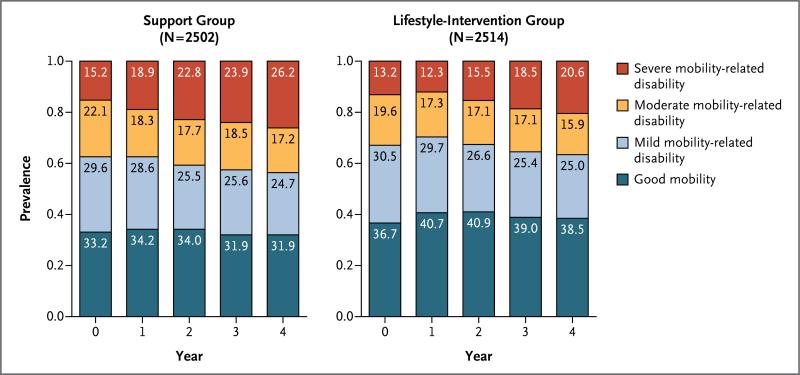
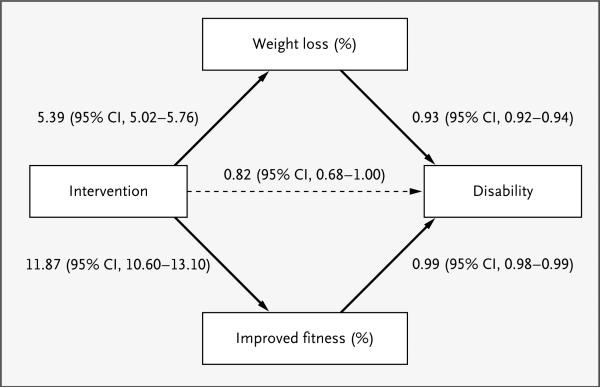
Results: At year 4, among 2514 adults in the lifestyle-intervention group, 517 (20.6%) had severe disability and 969 (38.5%) had good mobility; the numbers among 2502 participants in the support group were 656 (26.2%) and 798 (31.9%), respectively. The lifestyle-intervention group had a relative reduction of 48% in the risk of loss of mobility, as compared with the support group (odds ratio, 0.52; 95% confidence interval, 0.44 to 0.63; P<0.001). Both weight loss and improved fitness (as assessed on treadmill testing) were significant mediators of this effect (P<0.001 for both variables). Adverse events that were related to the lifestyle intervention included a slightly higher frequency of musculoskeletal symptoms at year 1.
Conclusions: Weight loss and improved fitness slowed the decline in mobility in overweight adults with type 2 diabetes. (Funded by the Department of Health and Human Services and others; ClinicalTrials.gov number, NCT00017953.).
Figures
Comment in
-
Weight loss and improved fitness slow down the decline in mobility in obese adults with type 2 diabetes.Evid Based Med. 2013 Apr;18(2):e18. doi: 10.1136/eb-2012-100788. Epub 2012 Jul 10. Evid Based Med. 2013. PMID: 22782922 Free PMC article. No abstract available.
References
-
- Engelgau MM, Geiss LS, Saaddine JB, et al. The evolving diabetes burden in the United States. Ann Intern Med. 2004;140:945–50. - PubMed
-
- Wild S, Roglic G, Green A, Sicree R, King H. Global prevalence of diabetes: estimates for the year 2000 and projections for 2030. Diabetes Care. 2004;27:1047–53. - PubMed
-
- Centers for Disease Control and Prevention Percentage of civilian, non-institutionalized population with diagnosed diabetes, by age, United States, 1980-2010. ( http://www.cdc.gov/diabetes/statistics/prev/national/figbyage.htm)
-
- Boyle JP, Honeycutt AA, Narayan KM, et al. Projection of diabetes burden through 2050: impact of changing demography and disease prevalence in the U.S. Diabetes Care. 2001;24:1936–40. - PubMed
Publication types
MeSH terms
Associated data
Grants and funding
- DK57078/DK/NIDDK NIH HHS/United States
- U01 DK057151/DK/NIDDK NIH HHS/United States
- DK57151/DK/NIDDK NIH HHS/United States
- U01 DK057171/DK/NIDDK NIH HHS/United States
- U01 DK057182/DK/NIDDK NIH HHS/United States
- U01 DK057136/DK/NIDDK NIH HHS/United States
- U01 DK057002/DK/NIDDK NIH HHS/United States
- U01 DK057177/DK/NIDDK NIH HHS/United States
- DK57008/DK/NIDDK NIH HHS/United States
- M01RR000056/RR/NCRR NIH HHS/United States
- DK57135/DK/NIDDK NIH HHS/United States
- P30 DK048520/DK/NIDDK NIH HHS/United States
- U01 DK057135/DK/NIDDK NIH HHS/United States
- UL1 RR024153/RR/NCRR NIH HHS/United States
- U01 HL101066/HL/NHLBI NIH HHS/United States
- P30 DK046204/DK/NIDDK NIH HHS/United States
- DK57171/DK/NIDDK NIH HHS/United States
- M01 RR002719/RR/NCRR NIH HHS/United States
- DK57131/DK/NIDDK NIH HHS/United States
- M01 RR000056/RR/NCRR NIH HHS/United States
- HL076441-01A1/HL/NHLBI NIH HHS/United States
- U01 DK057219/DK/NIDDK NIH HHS/United States
- R01AG031827A/AG/NIA NIH HHS/United States
- U01 DK057154/DK/NIDDK NIH HHS/United States
- P30-AG021332/AG/NIA NIH HHS/United States
- DK57149/DK/NIDDK NIH HHS/United States
- U01 DK056992/DK/NIDDK NIH HHS/United States
- M01RR01066/RR/NCRR NIH HHS/United States
- DK57182/DK/NIDDK NIH HHS/United States
- DK57002/DK/NIDDK NIH HHS/United States
- M01RR01346/RR/NCRR NIH HHS/United States
- R01 AG031827/AG/NIA NIH HHS/United States
- DK57178/DK/NIDDK NIH HHS/United States
- M01 RR000211/RR/NCRR NIH HHS/United States
- P30 DK48520/DK/NIDDK NIH HHS/United States
- M01 RR001066/RR/NCRR NIH HHS/United States
- U01HL101066-01/HL/NHLBI NIH HHS/United States
- U01 DK057078/DK/NIDDK NIH HHS/United States
- R01 HL076441/HL/NHLBI NIH HHS/United States
- U01 DK057131/DK/NIDDK NIH HHS/United States
- M01 RR000051/RR/NCRR NIH HHS/United States
- ImNIH/Intramural NIH HHS/United States
- DK57136/DK/NIDDK NIH HHS/United States
- M01-RR00211/RR/NCRR NIH HHS/United States
- DK57154/DK/NIDDK NIH HHS/United States
- DK57219/DK/NIDDK NIH HHS/United States
- DK57177/DK/NIDDK NIH HHS/United States
- U01 DK056990/DK/NIDDK NIH HHS/United States
- U01 DK057178/DK/NIDDK NIH HHS/United States
- U01 DK057008/DK/NIDDK NIH HHS/United States
- DK56990/DK/NIDDK NIH HHS/United States
- M01RR0021140/RR/NCRR NIH HHS/United States
- DK 046204/DK/NIDDK NIH HHS/United States
- U01 DK057149/DK/NIDDK NIH HHS/United States
- P30 AG021332/AG/NIA NIH HHS/United States
- UL1 RR 024153/RR/NCRR NIH HHS/United States
- M01RR02719/RR/NCRR NIH HHS/United States
- R18 HL076441/HL/NHLBI NIH HHS/United States
- M01 RR001346/RR/NCRR NIH HHS/United States
- DK56992/DK/NIDDK NIH HHS/United States
- P30 DK017047/DK/NIDDK NIH HHS/United States
- M01RR00051/RR/NCRR NIH HHS/United States