

Random hydrolysis controls the dynamic instability of microtubules
- PMID: 22455910
- PMCID: PMC3309290
- DOI: 10.1016/j.bpj.2011.12.059
Random hydrolysis controls the dynamic instability of microtubules
Abstract
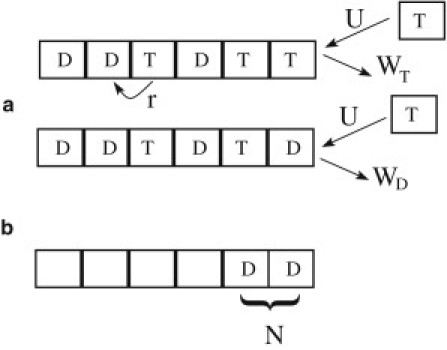
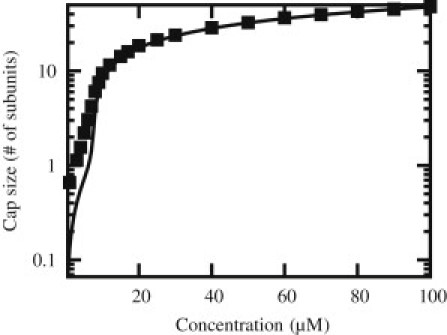
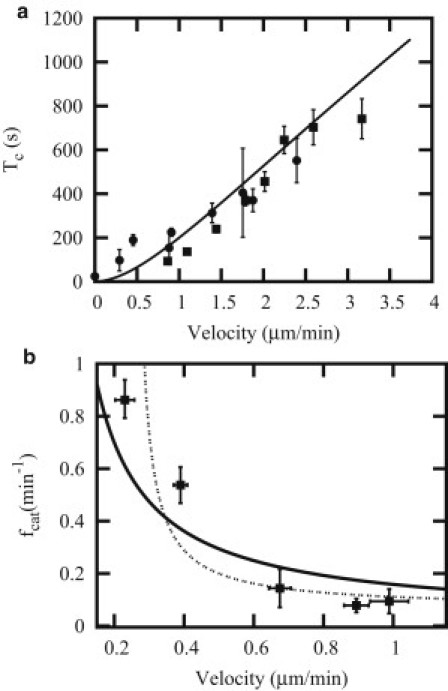
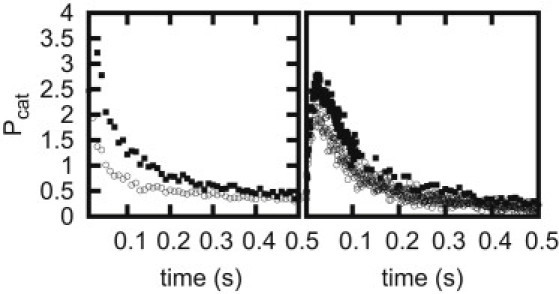
Uncovering mechanisms that control the dynamics of microtubules is fundamental for our understanding of multiple cellular processes such as chromosome separation and cell motility. Building on previous theoretical work on the dynamic instability of microtubules, we propose here a stochastic model that includes all relevant biochemical processes that affect the dynamics of microtubule plus-end, namely, the binding of GTP-bound monomers, unbinding of GTP- and GDP-bound monomers, and hydrolysis of GTP monomers. The inclusion of dissociation processes, present in our approach but absent from many previous studies, is essential to guarantee the thermodynamic consistency of the model. Our theoretical method allows us to compute all dynamic properties of microtubules explicitly. Using experimentally determined rates, it is found that the cap size is ∼3.6 layers, an estimate that is compatible with several experimental observations. In the end, our model provides a comprehensive description of the dynamic instability of microtubules that includes not only the statistics of catastrophes but also the statistics of rescues.
Copyright © 2012 Biophysical Society. Published by Elsevier Inc. All rights reserved.
Figures
Similar articles
-
Theoretical analysis of microtubules dynamics using a physical-chemical description of hydrolysis.J Phys Chem B. 2013 Aug 8;117(31):9217-23. doi: 10.1021/jp404794f. Epub 2013 Jul 30. J Phys Chem B. 2013. PMID: 23844777
-
Concerning the chemical nature of tubulin subunits that cap and stabilize microtubules.Biochemistry. 2003 Feb 25;42(7):2122-6. doi: 10.1021/bi027010s. Biochemistry. 2003. PMID: 12590601
-
The minimum GTP cap required to stabilize microtubules.Curr Biol. 1994 Dec 1;4(12):1053-61. doi: 10.1016/s0960-9822(00)00243-8. Curr Biol. 1994. PMID: 7704569
-
Guanosine-5'-triphosphate hydrolysis and tubulin polymerization. Review article.Mol Cell Biochem. 1982 Sep 3;47(2):97-113. doi: 10.1007/BF00234410. Mol Cell Biochem. 1982. PMID: 6755216 Review.
-
Microtubule dynamic instability and GTP hydrolysis.Annu Rev Biophys Biomol Struct. 1992;21:145-66. doi: 10.1146/annurev.bb.21.060192.001045. Annu Rev Biophys Biomol Struct. 1992. PMID: 1525467 Review. No abstract available.
Cited by
-
The effect of motor-induced shaft dynamics on microtubule stability and length.Biophys J. 2023 Jan 17;122(2):346-359. doi: 10.1016/j.bpj.2022.12.010. Epub 2022 Dec 9. Biophys J. 2023. PMID: 36502273 Free PMC article.
-
Signatures of a macroscopic switching transition for a dynamic microtubule.Sci Rep. 2017 Apr 4;7:45747. doi: 10.1038/srep45747. Sci Rep. 2017. PMID: 28374844 Free PMC article.
-
Hydrolysis-dependent severing tunes internal monomeric heterogeneity to shape actin length distributions.bioRxiv [Preprint]. 2025 May 30:2025.05.29.656816. doi: 10.1101/2025.05.29.656816. bioRxiv. 2025. PMID: 40502056 Free PMC article. Preprint.
-
The size of the EB cap determines instantaneous microtubule stability.Elife. 2016 Apr 6;5:e13470. doi: 10.7554/eLife.13470. Elife. 2016. PMID: 27050486 Free PMC article.
-
Microtubule dynamic instability: a new model with coupled GTP hydrolysis and multistep catastrophe.Bioessays. 2013 May;35(5):452-61. doi: 10.1002/bies.201200131. Epub 2013 Mar 27. Bioessays. 2013. PMID: 23532586 Free PMC article.
References
-
- Desai A., Mitchison T.J. Microtubule polymerization dynamics. Annu. Rev. Cell Dev. Biol. 1997;13:83–117. - PubMed
-
- Margolis R.L., Wilson L. Microtubule treadmilling: what goes around comes around. Bioessays. 1998;20:830–836. - PubMed
-
- Mitchison T., Kirschner M. Dynamic instability of microtubule growth. Nature. 1984;312:237–242. - PubMed
-
- Bayley P.M., Schilstra M.J., Martin S.R. A simple formulation of microtubule dynamics: quantitative implications of the dynamic instability of microtubule populations in vivo and in vitro. J. Cell Sci. 1989;93:241–254. - PubMed
Publication types
MeSH terms
Substances
LinkOut - more resources
Full Text Sources
Miscellaneous
