

Cardiac cellular coupling and the spread of early instabilities in intracellular Ca2+
- PMID: 22455912
- PMCID: PMC3309286
- DOI: 10.1016/j.bpj.2012.02.034
Cardiac cellular coupling and the spread of early instabilities in intracellular Ca2+
Abstract
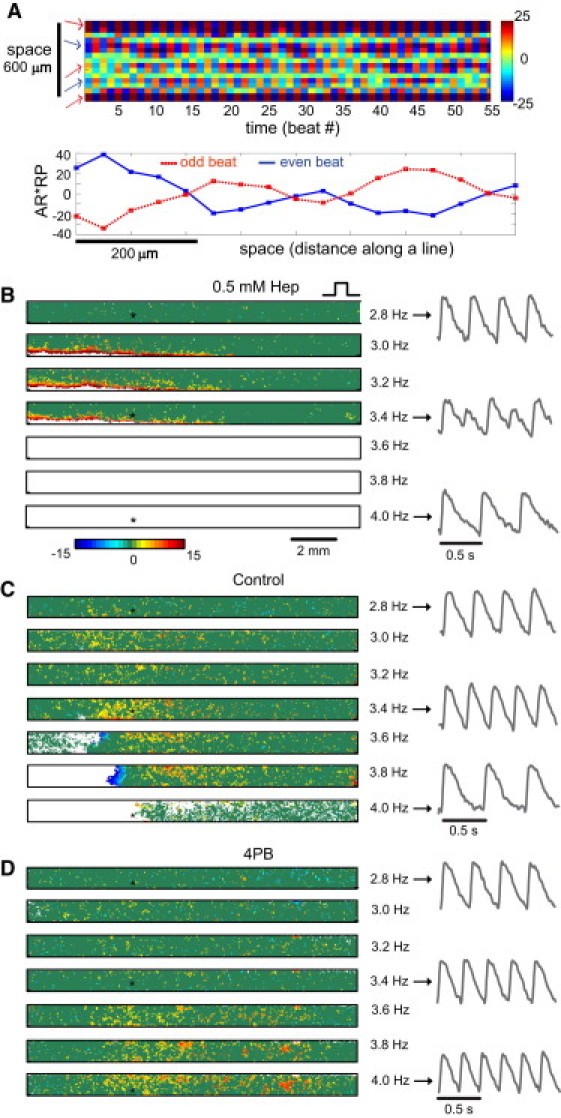
Recent experimental and modeling studies demonstrate the fine spatial scale, complex nature, and independent contribution of Ca(2+) dynamics as a proarrhythmic factor in the heart. The mechanism of progression of cell-level Ca(2+) instabilities, known as alternans, to tissue-level arrhythmias is not well understood. Because gap junction coupling dictates cardiac syncytial properties, we set out to elucidate its role in the spatiotemporal evolution of Ca(2+) instabilities. We experimentally perturbed cellular coupling in cardiac syncytium in vitro. Coupling was quantified by fluorescence recovery after photobleaching, and related to function, including subtle fine-scale Ca(2+) alternans, captured by optical mapping. Conduction velocity and threshold for alternans monotonically increased with coupling. Lower coupling enhanced Ca(2+) alternans amplitude, but the spatial spread of early (<2 Hz) alternation was the greatest under intermediate (not low) coupling. This nonmonotonic relationship was closely matched by the percent of samples exhibiting large-scale alternans at higher pacing rates. Computer modeling corroborated these experimental findings for strong but not weak electromechanical (voltage-Ca(2+)) coupling, and offered mechanistic insight. In conclusion, using experimental and modeling approaches, we reveal a general mechanism for the spatial spread of subtle cellular Ca(2+) alternans that relies on a combination of gap-junctional and voltage-Ca(2+) coupling.
Copyright © 2012 Biophysical Society. Published by Elsevier Inc. All rights reserved.
Figures


Similar articles
-
Membrane potential determines calcium alternans through modulation of SR Ca2+ load and L-type Ca2+ current.J Mol Cell Cardiol. 2017 Apr;105:49-58. doi: 10.1016/j.yjmcc.2017.02.004. Epub 2017 Feb 28. J Mol Cell Cardiol. 2017. PMID: 28257761 Free PMC article.
-
Spatially discordant alternans in cardiac tissue: role of calcium cycling.Circ Res. 2006 Sep 1;99(5):520-7. doi: 10.1161/01.RES.0000240542.03986.e7. Epub 2006 Aug 10. Circ Res. 2006. PMID: 16902177
-
Functional coupling between glycolysis and excitation-contraction coupling underlies alternans in cat heart cells.J Physiol. 2000 May 1;524 Pt 3(Pt 3):795-806. doi: 10.1111/j.1469-7793.2000.00795.x. J Physiol. 2000. PMID: 10790159 Free PMC article.
-
Local calcium gradients during excitation-contraction coupling and alternans in atrial myocytes.J Physiol. 2003 Jan 1;546(Pt 1):19-31. doi: 10.1113/jphysiol.2002.025239. J Physiol. 2003. PMID: 12509476 Free PMC article. Review.
-
From pulsus to pulseless: the saga of cardiac alternans.Circ Res. 2006 May 26;98(10):1244-53. doi: 10.1161/01.RES.0000224540.97431.f0. Circ Res. 2006. PMID: 16728670 Review.
Cited by
-
Intracellular calcium signals display an avalanche-like behavior over multiple lengthscales.Front Physiol. 2012 Sep 3;3:350. doi: 10.3389/fphys.2012.00350. eCollection 2012. Front Physiol. 2012. PMID: 22969730 Free PMC article.
-
The effects of the histone deacetylase inhibitor 4-phenylbutyrate on gap junction conductance and permeability.Front Pharmacol. 2013 Sep 3;4:111. doi: 10.3389/fphar.2013.00111. eCollection 2013. Front Pharmacol. 2013. PMID: 24027526 Free PMC article.
-
Computational approaches to understand cardiac electrophysiology and arrhythmias.Am J Physiol Heart Circ Physiol. 2012 Oct 1;303(7):H766-83. doi: 10.1152/ajpheart.01081.2011. Epub 2012 Aug 10. Am J Physiol Heart Circ Physiol. 2012. PMID: 22886409 Free PMC article. Review.
-
Cardiac Alternans: Mechanisms and Clinical Utility in Arrhythmia Prevention.J Am Heart Assoc. 2019 Nov 5;8(21):e013750. doi: 10.1161/JAHA.119.013750. Epub 2019 Oct 16. J Am Heart Assoc. 2019. PMID: 31617437 Free PMC article. Review. No abstract available.
-
Optical control of excitation waves in cardiac tissue.Nat Photonics. 2015 Dec;9(12):813-816. doi: 10.1038/nphoton.2015.196. Epub 2015 Oct 19. Nat Photonics. 2015. PMID: 27057206 Free PMC article.
References
Publication types
MeSH terms
Substances
Grants and funding
LinkOut - more resources
Full Text Sources
Miscellaneous
