. 2012 Apr;129(4):838-847.
doi: 10.1097/PRS.0b013e3182450b47.

Regulation of adipogenesis by lymphatic fluid stasis: part II. Expression of adipose differentiation genes

Affiliations

Regulation of adipogenesis by lymphatic fluid stasis: part II. Expression of adipose differentiation genes

Seth Aschen et al. Plast Reconstr Surg. 2012 Apr.

Abstract

Background: Although fat deposition is a defining clinical characteristic of lymphedema, the cellular mechanisms that regulate this response remain unknown. The goal of this study was to determine how lymphatic fluid stasis regulates adipogenic gene activation and fat deposition.

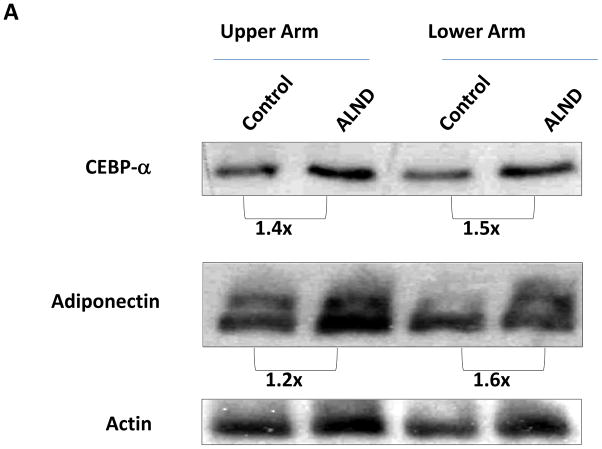
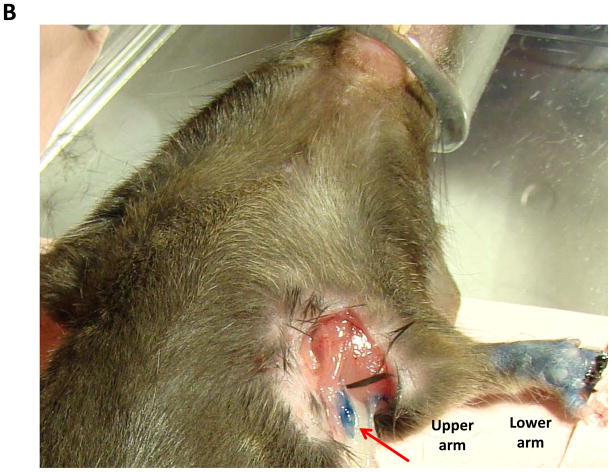
Methods: Adult female mice underwent tail lymphatic ablation and were euthanied at 1, 3, or 6 weeks postoperatively (n = 8 per group). Samples were analyzed by immunohistochemistry and Western blot analysis. An alternative group of mice underwent axillary dissections or sham incisions, and limb tissues were harvested 3 weeks postoperatively (n = 8 per group).

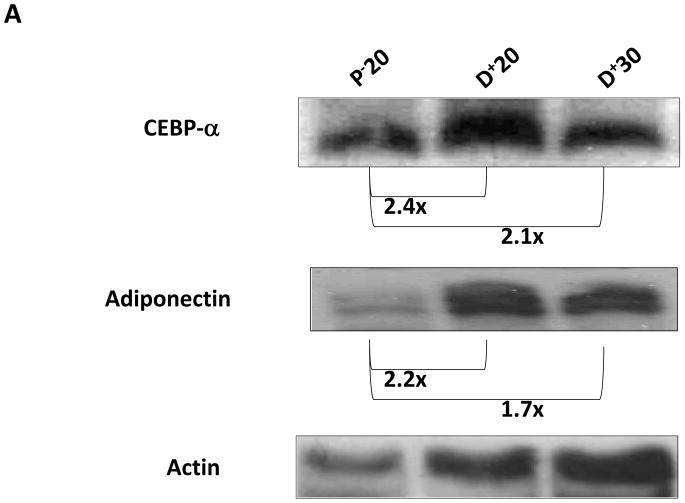
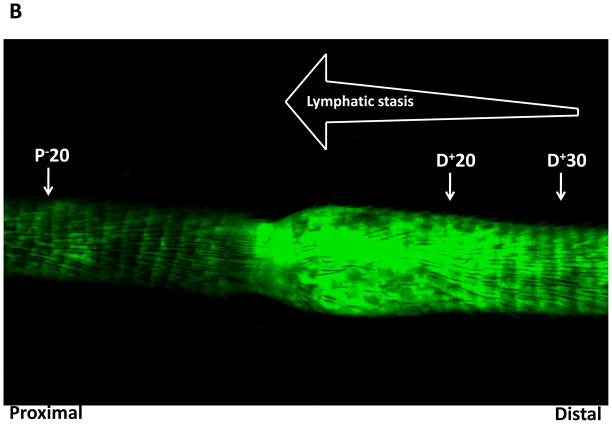
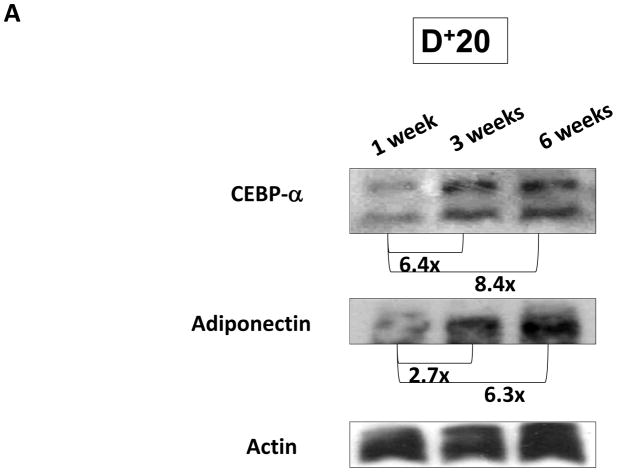
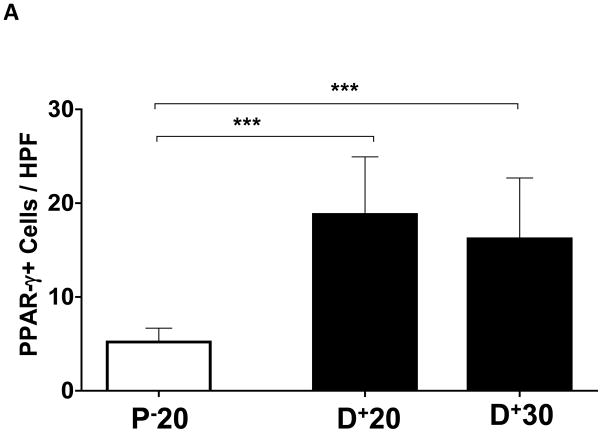
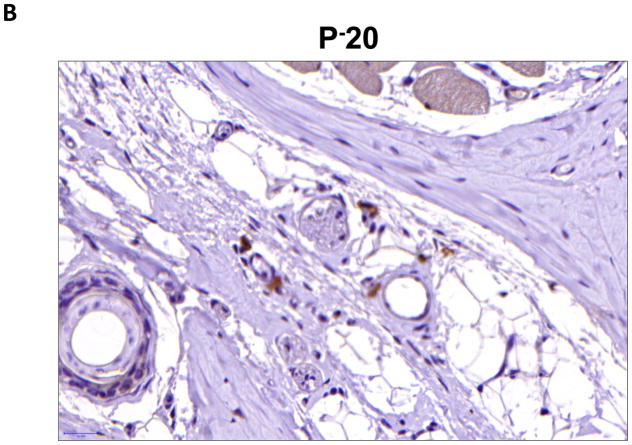
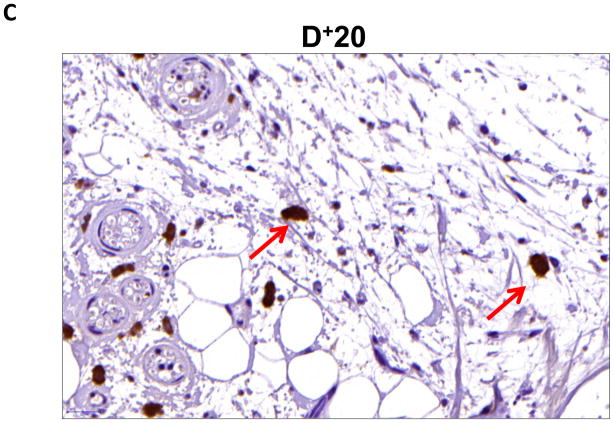
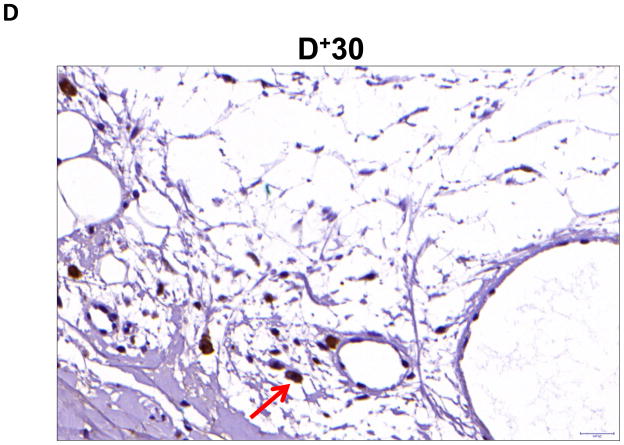
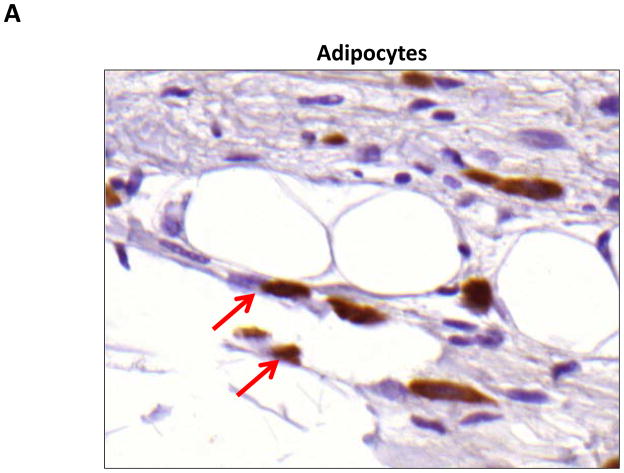
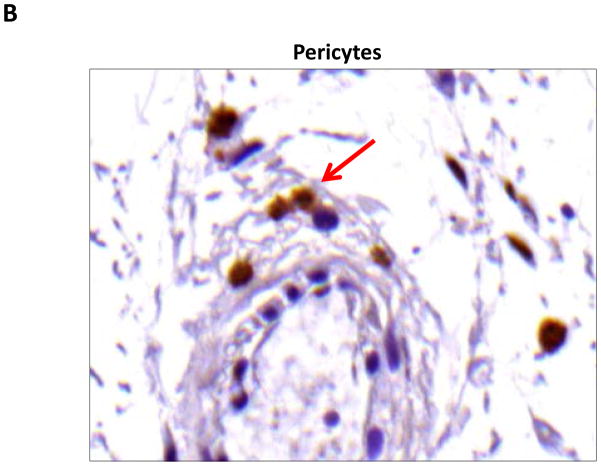
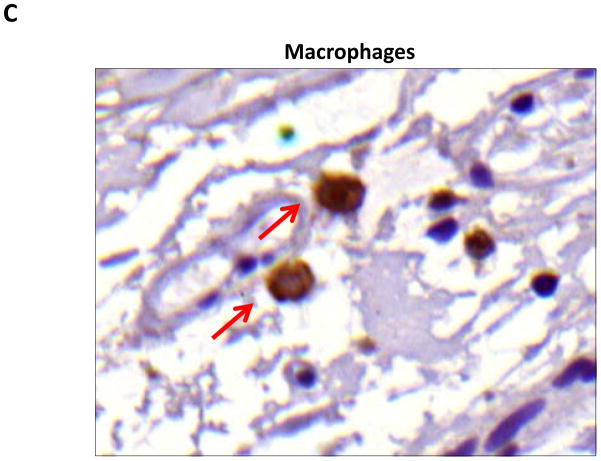
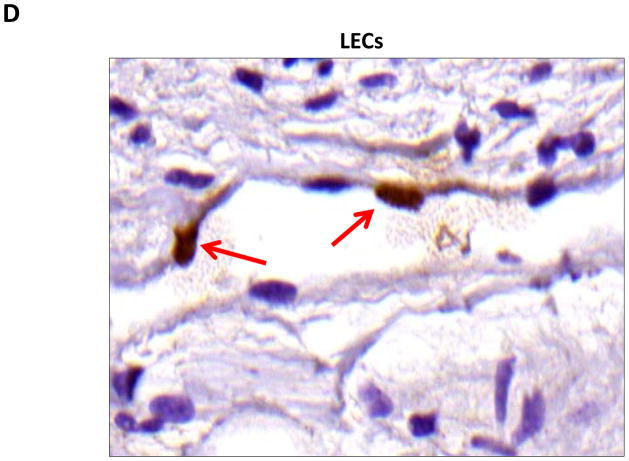
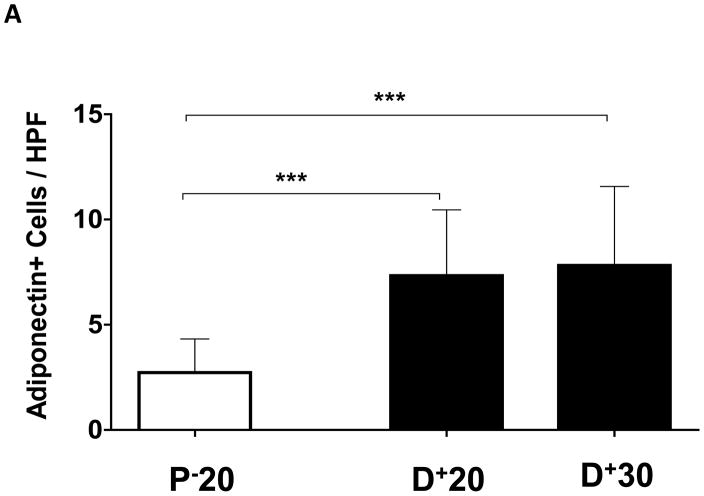
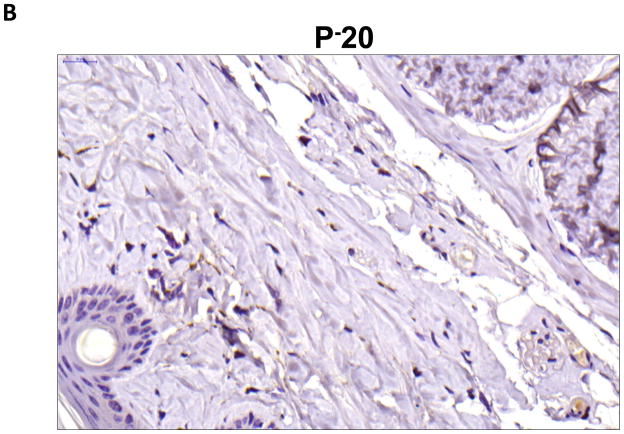
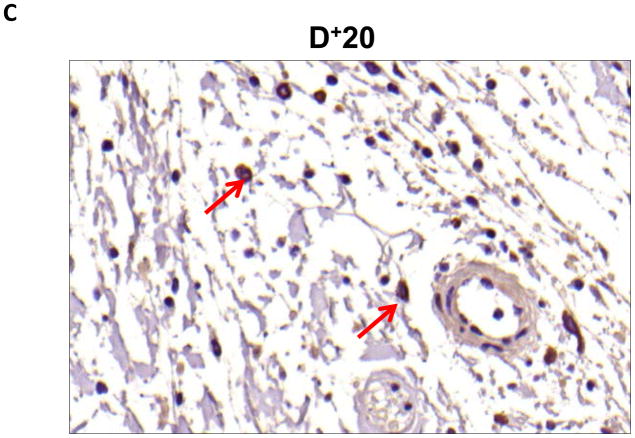
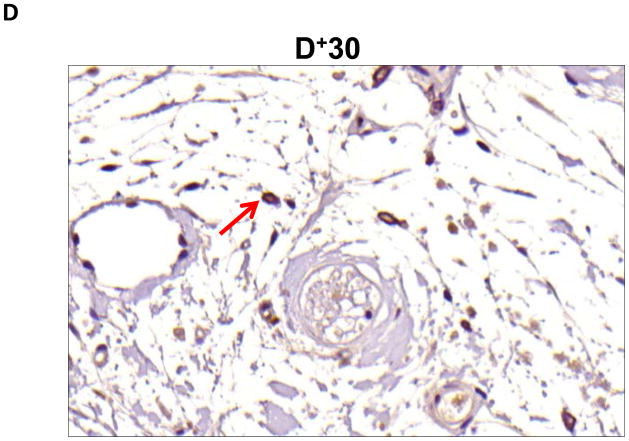
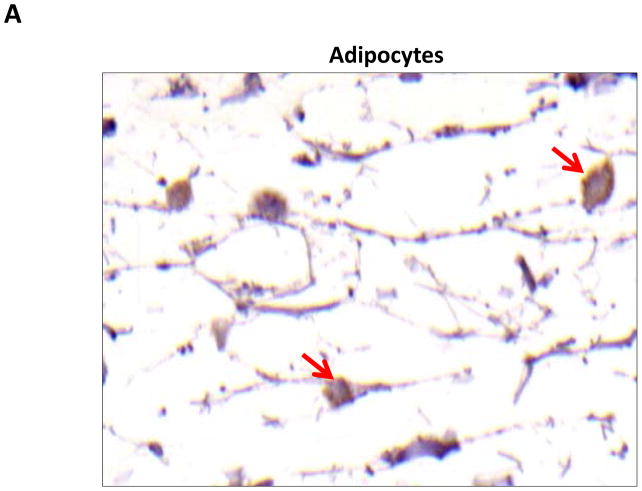
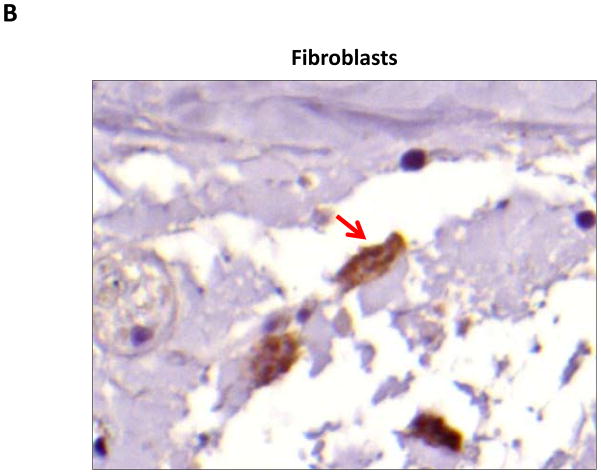
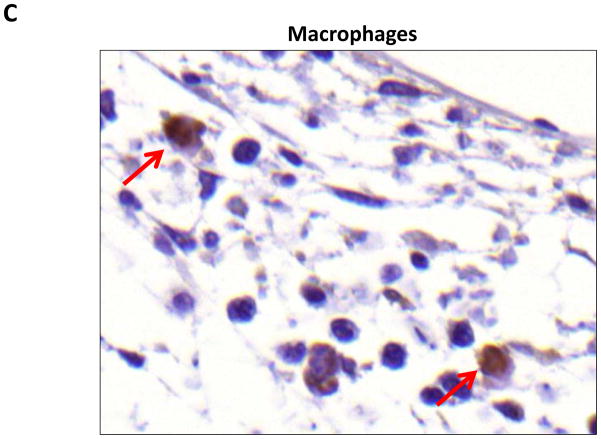
Results: Lymphatic fluid stasis resulted in significant subcutaneous fat deposition and fibrosis in lymphedematous tail regions (p < 0.001). Western blot analysis demonstrated that proteins regulating adipose differentiation including CCAAT/enhancer-binding protein-α and adiponectin were markedly up-regulated in response to lymphatic fluid stasis in the tail and axillary models. Expression of these markers increased in edematous tissues according to the gradient of lymphatic stasis distal to the wound. Immunohistochemical analysis further demonstrated that adiponectin and peroxisome proliferator-activated receptor-γ, another critical adipogenic transcription factor, followed similar expression gradients. Finally, adiponectin and peroxisome proliferator-activated receptor-γ expression localized to a variety of cell types in newly formed subcutaneous fat.

Conclusions: The mouse-tail model of lymphedema demonstrates pathologic findings similar to clinical lymphedema, including fat deposition and fibrosis. The authors show that lymphatic fluid stasis potently up-regulates the expression of fat differentiation markers both spatially and temporally. These studies elucidate mechanisms regulating abnormal fat deposition in lymphedema pathogenesis and therefore provide a basis for developing targeted treatments.


Conflict of interest statement

Disclosures: None of the authors have any conflicts of interests or relevant disclosures to the findings presented in this study.

Figures

FIGURE 1
FIGURE 1. Gradients of lymphatic fluid stasis regulate expression of fat differentiation genes in the mouse tail model
A. Representative western blot (of triplicate studies) for CEPB-α, adiponectin, and actin in tissues harvested proximal (P20) or distal (D+20 or D+30) to the zone of lymphatic obstruction. Tissues were harvested 6 weeks following tail surgery. Fold changes relative to proximal region and corrected for actin using ImageJ software are shown for each western blot. B. Representative microlymphangiography of the mouse tail 6-weeks after tail lymphatic excision demonstrating gradients of lymphatic fluid stasis in the distal regions of the tail (increasing fluorescent color). Also marked are the regions harvested for western blot analysis in A.
FIGURE 2
FIGURE 2. Gradients of lymphatic fluid stasis regulate expression of fat differentiation genes after axillary lymph node dissection
A. Representative western blot (of triplicate studies) for CEPB-α, adiponectin, and actin in tissues harvested from the upper or lower regions of the upper extremity in mice who had undergone control (incision only) or axillary lymphadenectomy (ALND). Fold changes relative to control and corrected for actin using ImageJ software are shown for each western blot. B. Gross photograph of the mouse axillary dissection model demonstrating regions of the arm harvested for protein analysis. Also note blue lymph node (red arrow) in axilla.
FIGURE 3
FIGURE 3. Expression of fat differentiation markers is increased temporally with sustained lymphatic fluid stasis
Representative western blot (of triplicate studies) for CEPB-α, adiponectin, IL-6, and actin in tissues harvested distal (D+20) to the zone of lymphatic obstruction (gross photograph is shown for orientation to location of tissue harvest) 1, 3, or 6 weeks after surgery. Fold changes relative to 1 week time point and corrected for actin using ImageJ software are shown for each western blot.
FIGURE 4
FIGURE 4. Gradients of lymphatic fluid stasis regulate the expression of PPAR-γ
A. PPAR-γ+ cells/high powered field (HPF) cell counts in the various regions of the tail relative to the zone of lymphatic obstruction. Note significant increase in the number of PPAR-γ+ cells/HPF in distal sections (***p<0.001). B, C, D. Representative high (40x) images of cross-sectional regions of the mouse tail relative to the zone of lymphatic obstruction stained for PPAR-γ. Note increased number of positively stained cells in the distal regions. Also note staining of mononuclear cells in subcutaneous fat in distal regions (red arrows).
FIGURE 5
FIGURE 5. PPAR-γ is expressed by a variety of cell types in response to lymphatic fluid stasis
AD. PPAR-γ staining (red arrows) of adipocytes (A), pericytes (B), macrophages (C), and lymphatic endothelial cells (LECS; D) shown in representative high power (80X) images of the distal region (D+20) of the tail.
FIGURE 6
FIGURE 6. Gradients of lymphatic fluid stasis regulate the expression of adiponectin
A. Adiponectin+ cells/high powered field (HPF) cell counts in the various regions of the tail relative to the zone of lymphatic obstruction. Note significant increase in the number of adiponectin+ cells/HPF in distal sections (***p<0.001). BD. Representative high power (40x images of cross-sectional regions of the mouse tail relative to the zone of lymphatic obstruction stained for adiponectin. Note staining of mononuclear cells in subcutaneous fat in distal regions (red arrows).
FIGURE 7
FIGURE 7. Adiponectin is expressed by a variety of cell types in response to lymphatic fluid stasis
AC. Adiponectinstaining (red arrows) of adipocytes (A), fibroblasts (B), and macrophages shown in representative high power (80X) images of the distal region (D+20) of the tail.
FIGURE 7
FIGURE 7. Adiponectin is expressed by a variety of cell types in response to lymphatic fluid stasis
AC. Adiponectinstaining (red arrows) of adipocytes (A), fibroblasts (B), and macrophages shown in representative high power (80X) images of the distal region (D+20) of the tail.
FIGURE 7
FIGURE 7. Adiponectin is expressed by a variety of cell types in response to lymphatic fluid stasis
AC. Adiponectinstaining (red arrows) of adipocytes (A), fibroblasts (B), and macrophages shown in representative high power (80X) images of the distal region (D+20) of the tail.

References

    1. Clavin NW, Avraham T, Fernandez J, et al. TGF-beta1 is a negative regulator of lymphatic regeneration during wound repair. Am J Physiol Heart Circ Physiol. 2008;295:H2113–2127. - PubMed
    1. Avraham T, Clavin NW, Daluvoy SV, et al. Fibrosis is a key inhibitor of lymphatic regeneration. Plast Reconstr Surg. 2009;124:438–450. - PubMed
    1. Avraham T, Daluvoy S, Zampell J, et al. Blockade of Transforming Growth Factor-{beta}1 Accelerates Lymphatic Regeneration during Wound Repair. Am J Pathol. 2010;177:3202–3214. - PMC - PubMed
    1. Zampell JC, Yan A, Avraham T, et al. Temporal and spatial patterns of endogenous danger signal expression after wound healing and in response to lymphedema. Am J Physiol Cell Physiol. 2011 - PMC - PubMed
    1. Avraham T, Daluvoy S, Zampell J, et al. Blockade of transforming growth factor-beta1 accelerates lymphatic regeneration during wound repair. Am J Pathol. 177:3202–3214. - PMC - PubMed

Publication types

MeSH terms