. 2012 Sep 7;9(74):2341-50.
doi: 10.1098/rsif.2012.0024. Epub 2012 Mar 28.

Identifying individual DNA species in a complex mixture by precisely measuring the spacing between nicking restriction enzymes with atomic force microscope

Affiliations

Identifying individual DNA species in a complex mixture by precisely measuring the spacing between nicking restriction enzymes with atomic force microscope

Jason Reed et al. J R Soc Interface. .

Abstract

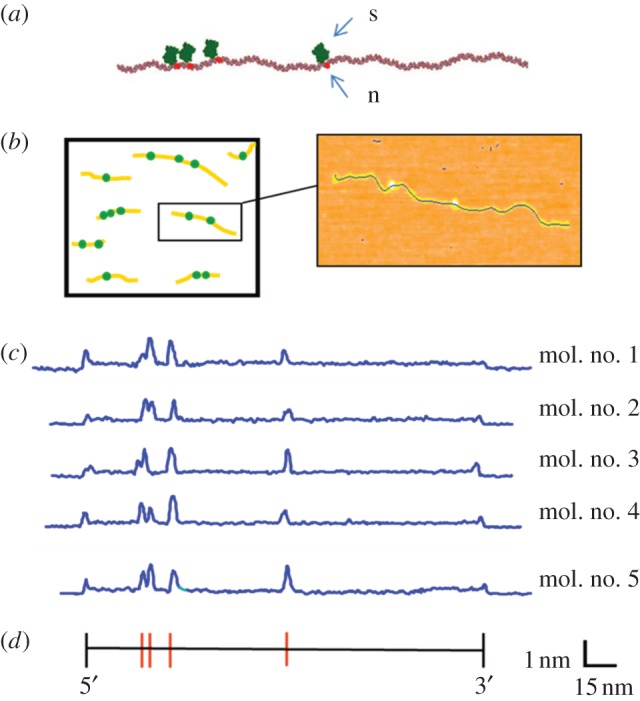
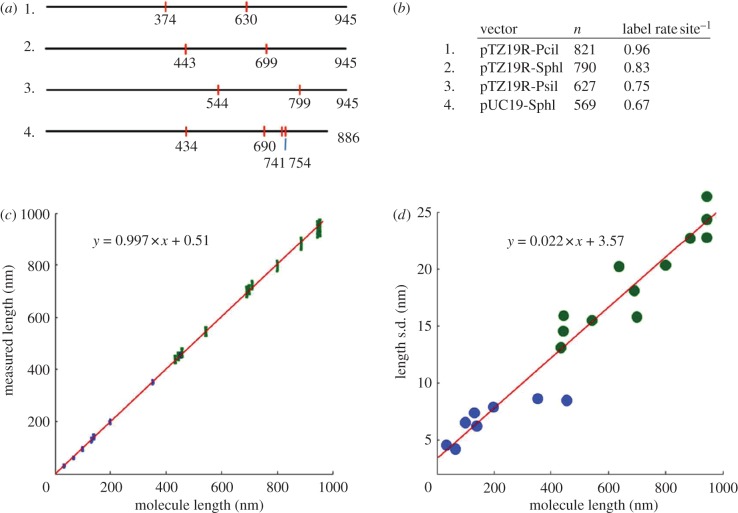
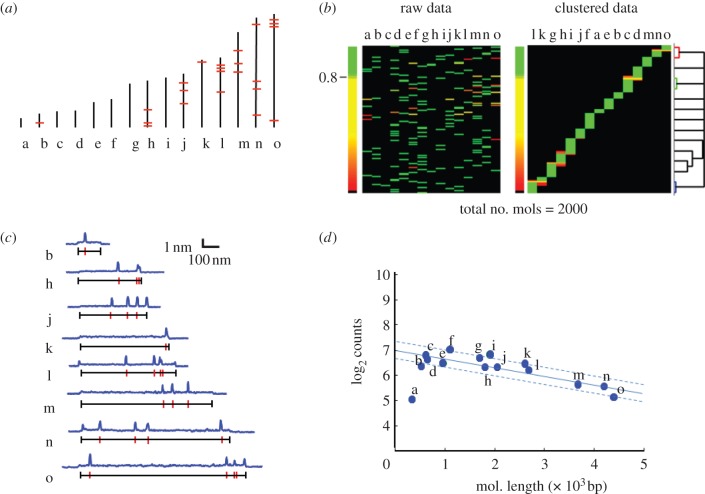
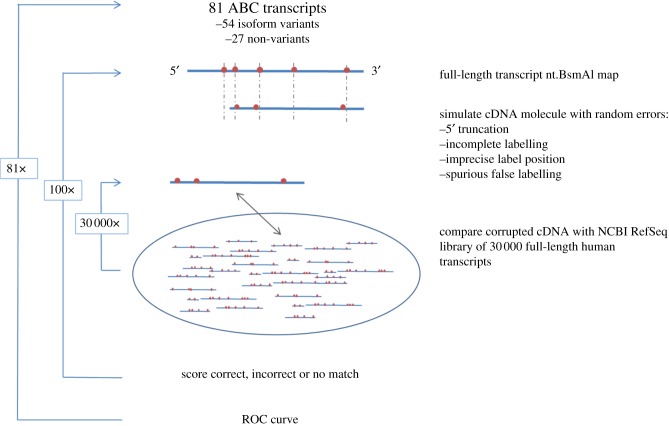
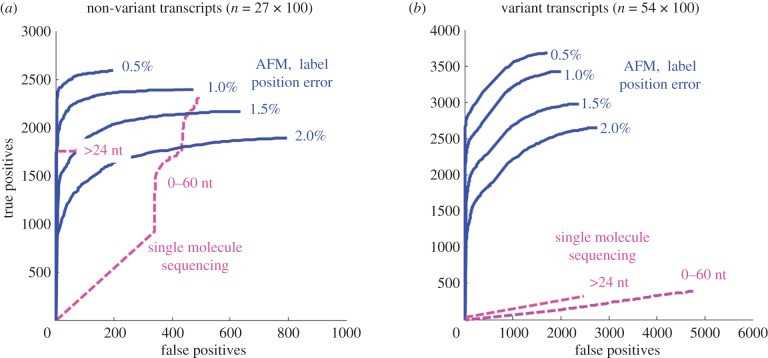
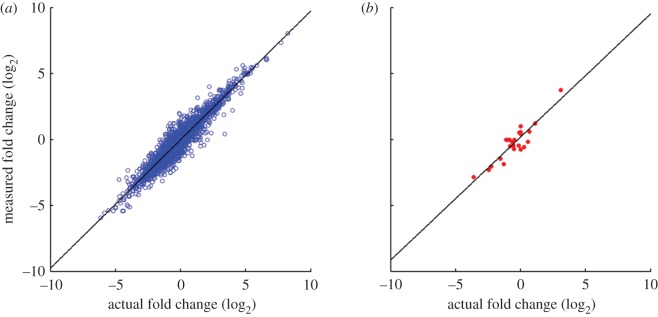
We discuss a novel atomic force microscope-based method for identifying individual short DNA molecules (<5000 bp) within a complex mixture by measuring the intra-molecular spacing of a few sequence-specific topographical labels in each molecule. Using this method, we accurately determined the relative abundance of individual DNA species in a 15-species mixture, with fewer than 100 copies per species sampled. To assess the scalability of our approach, we conducted a computer simulation, with realistic parameters, of the hypothetical problem of detecting abundance changes in individual gene transcripts between two single-cell human messenger RNA samples, each containing roughly 9000 species. We found that this approach can distinguish transcript species abundance changes accurately in most cases, including transcript isoforms which would be challenging to quantitate with traditional methods. Given its sensitivity and procedural simplicity, our approach could be used to identify transcript-derived complementary DNAs, where it would have substantial technical and practical advantages versus established techniques in situations where sample material is scarce.


Figures

Figure 1.
Figure 1.
Topographic labelling with nicking restriction endonucleases. (a) A free 3′OH group is generated on one strand of the double helix by a nicking enzyme (n), followed by enzymatic addition of biotin and streptavidin (s) at the modified site, for the purpose of rendering the site readily identifiable in an AFM image. This chemistry can be performed in solution, followed by deposition of the sample on mica for AFM imaging. (b) Many individual molecules are imaged together, and the number and spacing of streptavidin labels is subsequently determined. (c) Experimentally measured AFM height profiles of linearized pUC19 plasmids labelled at the nt.BsmAI recognition sequence (5′-GTCTC-3′), indicated by the red bars in the sequence map, below. The backbone profiles of five fully labelled molecules are identical, demonstrating the repeatability of the process.
Figure 2.
Figure 2.
Labelling efficiency and functional form of label positioning error. (a) Four constructs derived from linearized plasmids pUC19 and pTZ19R used to estimate topographic labelling efficiency and positional measurement error. Red marks indicate the location, in nanometres, of the nt.BsmAI nick sites with respect to the left end of each molecule. (b) Labelling efficiency per site determined from measurement of populations of each of the four constructs. (c) Plot of measured versus expected label position and total contour length for labelled constructs (green) and unlabelled DNA molecules (blue), as determined by AFM. The error bars represent ±1 s.d. about the mean. (d) Plot of measurement precision (s.d.) versus size for labelled constructs (green) and unlabelled DNA molecules (blue).
Figure 3.
Figure 3.
Identifying individual species in a mixture. (a) Nt.BsmAI sequence maps (red bars) of 15 fragments from a ClaI digest of lambda phage genomic DNA ordered by total length. The smallest fragment, species ‘a’, is 354 bp or 177 nm, and the longest fragment, species ‘o’, is 4398 bp or 1451 nm. (b) Height profiles of 2000 molecules, comprising equal amounts of species a-o, were matched uniquely to the known patterns for the 15 species. The data are represented as 2000 row×15 column matrix, where each row represents a single molecule, and the likelihood that it matches one of the 15 patterns, a-o, is given by the colour in the corresponding column. (Note that not all 2000 rows are resolved owing to the resolution of the printed figure). The large majority of molecules were assigned to a specific species with high confidence (green colour, probability of match >80%). The ‘raw data’ are ordered column-wise by pattern length. The data were re-ordered using a pairwise hierarchical clustering algorithm; the resulting order of the columns represents the relative similarity between the species' nt.BsmAI labelling pattern and the area of the ‘blocks’ in each column is proportional to the number of assigned counts for that species. (c) Typical AFM-derived height profiles of single, labelled molecules (blue trace), and the accompanying predicted location of nt.BsmAI recognition sites (red bars). (d) Plot of the total counts (log2) determined by AFM analysis of approximately 2000 tagged molecules. The median number of counts per species is 90. The solid line is a linear fit to the abundance of fragments versus length, excluding the outlier ‘a’. The standard error, indicated by the dashed lines on the plot, is ±15 counts (0.28 log2). This corresponds to a median estimated coefficient of variation (CV) of approximately 17%.
Figure 4.
Figure 4.
Schematic of simulated experiment distinguishing 81 individual transcripts from the ATP-binding cassette (ABC) superfamily from a background of 30 000 alternative human transcripts. For each ABC transcript, 100 hypothetical cDNA molecules were generated. Each hypothetical cDNA was ‘corrupted’ using a stochastic model that follows experimental and measurement errors: 5′ truncation owing to incomplete reverse transcription, incomplete nick site labelling, inaccurate label positioning and spurious false labelling. Each simulated cDNA molecule was compared with 29 563 human mRNA transcripts from the National Center for Biotechnology Information (NCBI) Reference Sequence (RefSeq) database, and scored pairwise for alignment quality.
Figure 5.
Figure 5.
Receiver-operating characteristic (ROC) analysis of matching 100 simulated transcripts from each member of the ABC gene family using either topographic labels, as determined by AFM, or single molecule tag sequencing. Separate ROC curves are shown for a range of label position errors, from 0.5 to 2.0%. Results from single molecule sequencing are shown using all simulated reads, and reads greater than 24 nucleotides in length. (a) Results for transcripts with only one variant (27 species). (b) Results for transcripts with two or more variants (54 species).
Figure 6.
Figure 6.
Correlation of actual versus predicted fold change between the Human Brain (HBRR) versus Universal Reference (UHRR) samples as predicted by simulation. Fold changes (log2) for each gene common between the two samples were subjected to bivariate analysis. (a) All genes that were detected in both samples (n = 4454; slope = 0.98, r2 = 0.91). (b) The 24 ABC transcripts present in both samples (all were detected) were plotted separately for clarity.

References

    1. Burbulis I., Yamaguchi K., Gordon A., Carlson R., Brent R. 2005. Using protein–DNA chimeras to detect and count small numbers of molecules. Nat. Methods 2, 31–3710.1038/nmeth729 (doi:10.1038/nmeth729) - DOI - DOI - PubMed
    1. Nygaard V., Hovig E. 2009. Methods for quantitation of gene expression. Front. Biosci. 14, 552–56910.2741/3262 (doi:10.2741/3262) - DOI - DOI - PubMed
    1. Nygaard V., Holden M., Loland A., Langaas M., Myklebost O., Hovig E. 2005. Limitations of mRNA amplification from small-size cell samples. BMC Genom. 6, 147.10.1186/1471-2164-6-147 (doi:10.1186/1471-2164-6-147) - DOI - DOI - PMC - PubMed
    1. Shi L. M., et al. 2006. The MicroArray Quality Control (MAQC) project shows inter- and intraplatform reproducibility of gene expression measurements. Nat. Biotechnol. 24, 1151–116110.1038/nbt1239 (doi:10.1038/nbt1239) - DOI - DOI - PMC - PubMed
    1. Bishop J. O., Morton J. G., Rosbash M., Richards M. 1974. Three abundance classes in HeLa-cell messenger-RNA. Nature 250, 199–20410.1038/250199a0 (doi:10.1038/250199a0) - DOI - DOI - PubMed

Publication types

MeSH terms

LinkOut - more resources