

Comparison of indicators of iron deficiency in Kenyan children
- PMID: 22456661
- PMCID: PMC4697948
- DOI: 10.3945/ajcn.111.029900
Comparison of indicators of iron deficiency in Kenyan children
Abstract
Background: In the absence of a feasible, noninvasive gold standard, iron deficiency (ID) is best measured by the use of multiple indicators. However, the choice of an appropriate single iron biomarker to replace the multiple-criteria model for screening for ID at the population level continues to be debated.
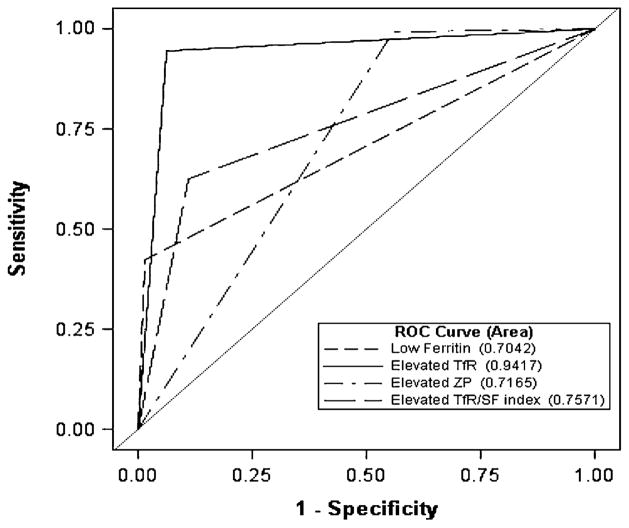
Objective: We compared ID defined as ≥ 2 of 3 abnormal ferritin (< 12 μg/L), soluble transferrin receptor (TfR; > 8.3 mg/L), or zinc protoporphyrin (ZP; > 80 μmol/mol) concentrations (ie, multiple-criteria model) with ID defined by abnormal concentrations of any of the independent candidate iron biomarkers (ferritin alone, TfR alone, or ZP alone) and TfR/ferritin index (ID, > 500). Values either were adjusted for inflammation [as measured by C-reactive protein (> 5 mg/L) and α(1)-acid glycoprotein (> 1 g/L) before applying cutoffs for ID] or were unadjusted.
Design: In this community-based cluster survey, capillary blood was obtained from 680 children (aged 6-35 mo) for measurement of iron status by using ferritin, TfR, and ZP.
Results: On the basis of the multiple-criteria model, the mean (±SE) prevalence of ID was 61.9 ± 2.2%, whereas the prevalences based on abnormal ferritin, TfR, or ZP concentrations or an abnormal TfR/ferritin index were 26.9 ± 1.7%, 60.9 ± 2.2%, 82.8 ± 1.6%, and 43.1 ± 2.3%, respectively, for unadjusted values. The prevalences of ID were higher for adjusted values only for low ferritin and an elevated TfR/ferritin index compared with the unadjusted values. The κ statistics for agreement between the multiple-criteria model and the other iron indicators ranged from 0.35 to 0.88; TfR had the best agreement (κ = 0.88) with the multiple-criteria model. Positive predictive values of ID based on the other iron indicators in predicting ID based on the multiple-criteria model were highest for ferritin and TfR. Receiver operating characteristic curve analysis indicated that TfR (AUC = 0.94) was superior to the other indicators in diagnosing ID based on the multiple-criteria model (P < 0.001). The inflammation effect did not appear to alter these observations appreciably.
Conclusion: TfR better estimates the prevalence of ID in preschoolers than do ferritin, ZP, and the TfR/ferritin index on the basis of multiple indexes in a high inflammation, resource-poor setting. This trial was registered at clinicaltrials.gov as NCT101088958.
Trial registration: ClinicalTrials.gov NCT01088958.
Figures
References
-
- McLean E, Cogswell M, Egli I, Wojdyla D, de Benoist B. Worldwide prevalence of anaemia, WHO Vitamin and Mineral Nutrition Information System, 1993–2005. Public Health Nutr. 2009;12:444–54. - PubMed
-
- Majid Ezzati SVH, Lopez AD, Danaei G, Rodgers A, Mathers CD, Murray CJL. Global burden of disease and risk factors. In: Lopez AD, Ezzati M, Jamison DT, Murray CJL, editors. Global burden of disease and risk factors. Washington, DC: World Bank; 2006. - PubMed
-
- Haas JD, Brownlie TT. Iron deficiency and reduced work capacity: a critical review of the research to determine a causal relationship. J Nutr. 2001;131:676S–90S. - PubMed
-
- Brabin BJ, Hakimi M, Pelletier D. An analysis of anemia and pregnancy-related maternal mortality. J Nutr. 2001;131:604S–15S. - PubMed
-
- Brabin BJ, Premji Z, Verhoeff F. An analysis of anemia and child mortality. J Nutr. 2001;131:636S–48S. - PubMed
Publication types
MeSH terms
Substances
Associated data
Grants and funding
LinkOut - more resources
Full Text Sources
Medical
Research Materials
