. 2012 Mar 28;32(13):4457-72.
doi: 10.1523/JNEUROSCI.3668-11.2012.

Understanding how the brain changes its mind: microstimulation in the macaque frontal eye field reveals how saccade plans are changed

Affiliations

Understanding how the brain changes its mind: microstimulation in the macaque frontal eye field reveals how saccade plans are changed

Arjun Ramakrishnan et al. J Neurosci. .

Abstract

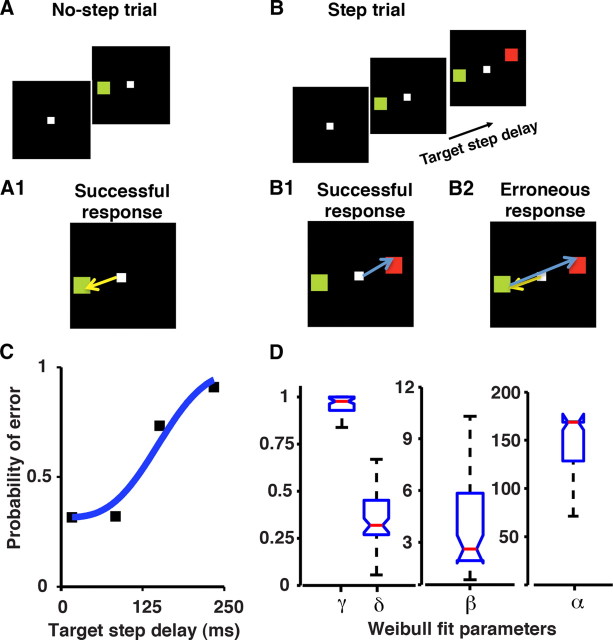
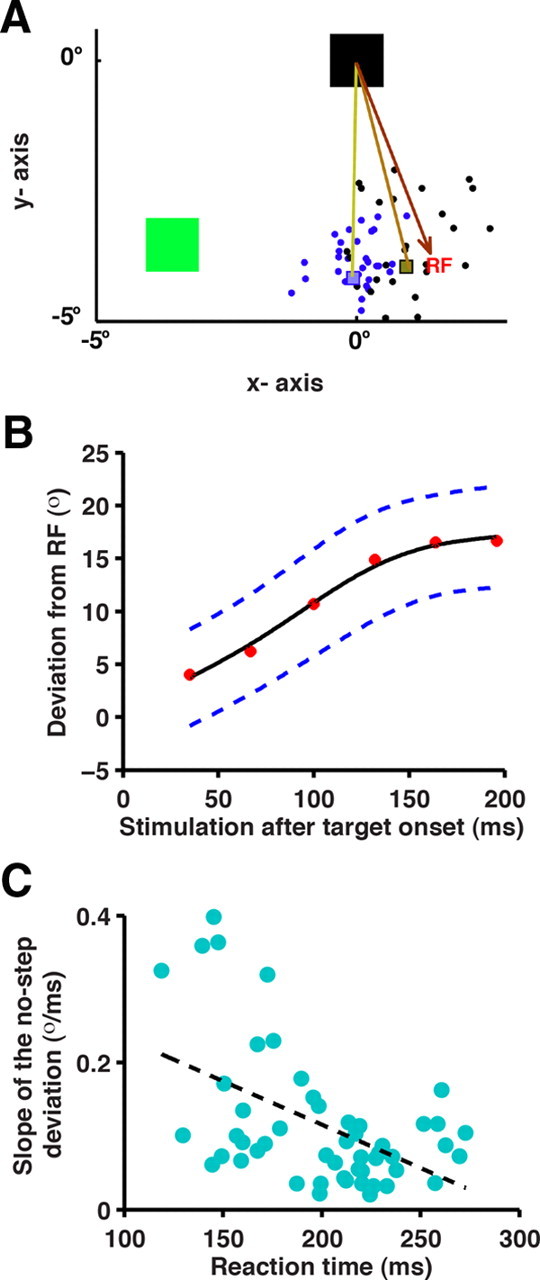
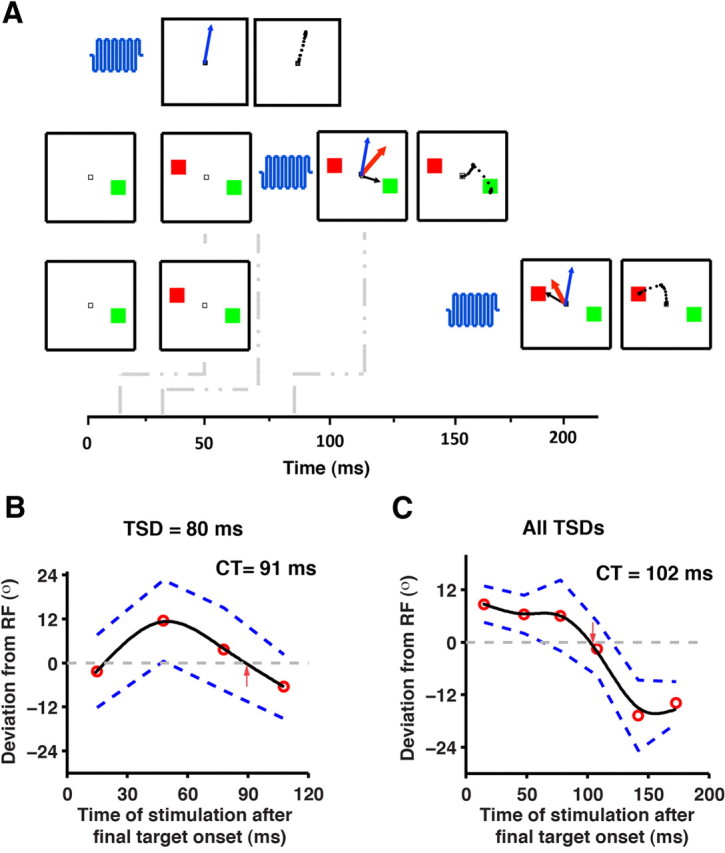
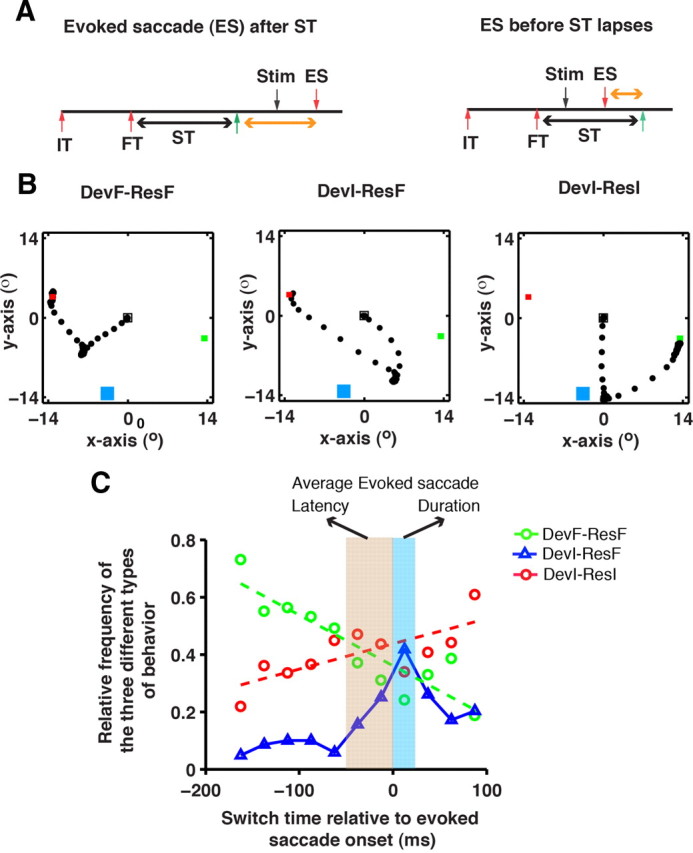
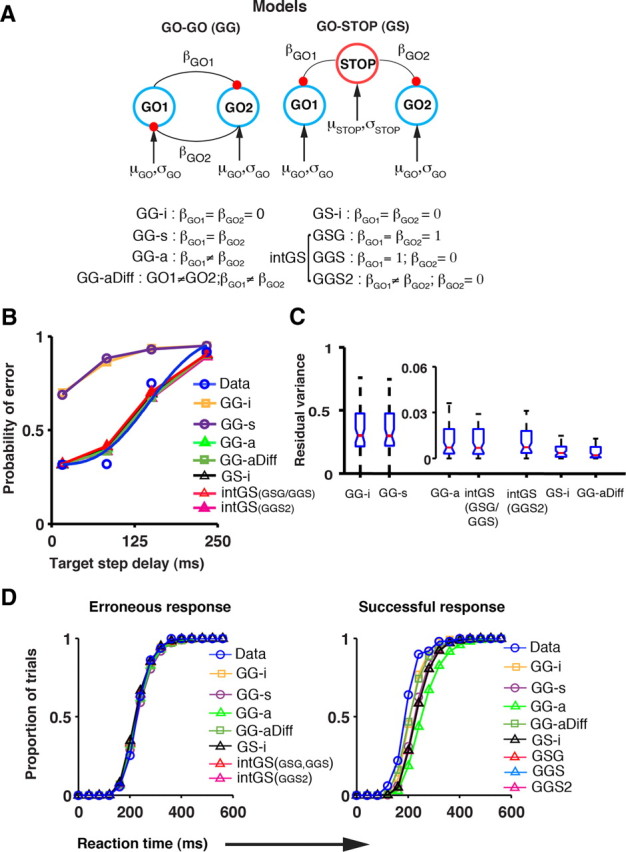
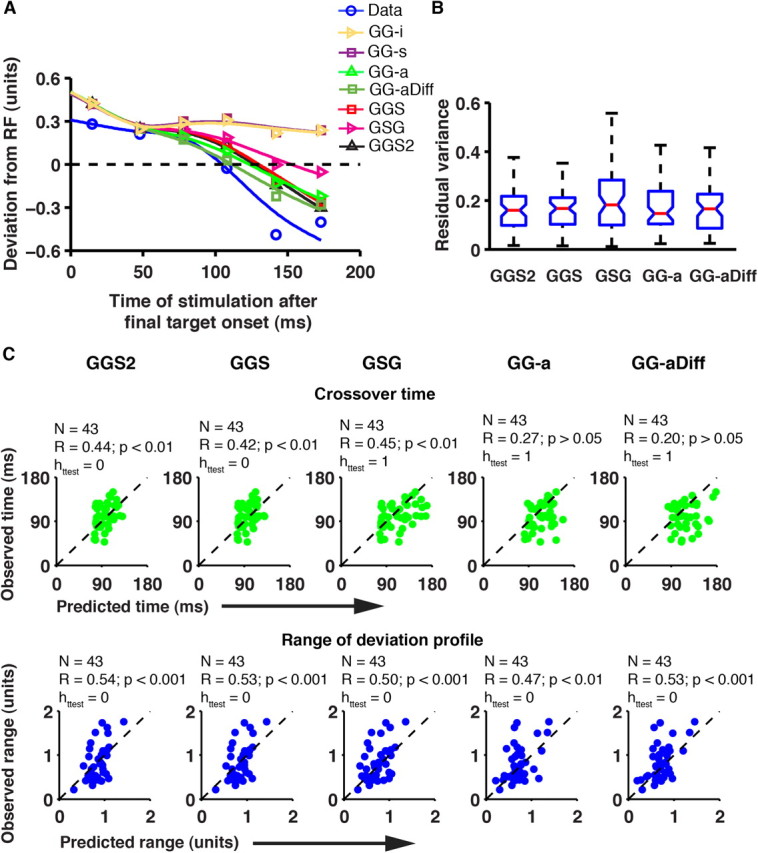
Accumulator models that integrate incoming sensory information into motor plans provide a robust framework to understand decision making. However, their applicability to situations that demand a change of plan raises an interesting problem for the brain. This is because interruption of the current motor plan must occur by a competing motor plan, which is necessarily weaker in strength. To understand how changes of mind get expressed in behavior, we used a version of the double-step task called the redirect task, in which monkeys were trained to modify a saccade plan. We microstimulated the frontal eye fields during redirect behavior and systematically measured the deviation of the evoked saccade from the response field to causally track the changing saccade plan. Further, to identify the underlying mechanisms, eight different computational models of redirect behavior were assessed. It was observed that the model that included an independent, spatially specific inhibitory process, in addition to the two accumulators representing the preparatory processes of initial and final motor plans, best predicted the performance and the pattern of saccade deviation profile in the task. Such an inhibitory process suppressed the preparation of the initial motor plan, allowing the final motor plan to proceed unhindered. Thus, changes of mind are consistent with the notion of a spatially specific, inhibitory process that inhibits the current inappropriate plan, allowing expression of the new plan.


Figures

Figure 1.
Figure 1.
Illustration of the temporal sequence of stimuli and behavior in the redirect task. A, B, The task comprised of no-step trials (A), when a single target (green square) appeared on the screen, and step trials (B), when a second target (red square) appeared after a delay (TSD). A1, In no-step trials, monkeys made a saccade, shown by the yellow arrow, to the target. In step trials, monkeys were required to withhold their initial saccade and instead initiate a saccade to the final target (blue arrow). B1, Sometimes, the monkeys successfully compensated for the target step. B2, On other occasions, they failed to compensate, which resulted in an erroneous saccade to the initial target, which was usually followed by a corrective saccade to the final target. C, Compensation functions. Black squares represent the probability of error at each TSD for a representative session. The solid-blue line is the Weibull fit. The probability of making the erroneous first saccade increases as TSD increases. D, Weibull fit parameters (α, β, γ, and δ) for the data from 2 monkeys (52 sessions) are shown as a boxplot. Whiskers, Range; blue box, interquartile range; notch, 95% confidence limit; red line, median.
Figure 2.
Figure 2.
Location of the recording well and the stimulation sites. A, Left, Top view of the recording well in the two monkeys. Right, Cortical areas beneath the well, seen within the red outline, accessible to the microelectrode. As, Arcuate sulcus. All images are 3-D reconstructed 3 T MR images. B, Each dot represents a stimulation site in the anteroposterior (A-P)–mediolateral (M-L) plane relative to the center of the recording well with coordinates of (6, 6). The color indicates the number of stimulation sites at the coordinate location but at different depths.
Figure 3.
Figure 3.
Evoked saccade deviation in no-step trials. A, The fixation spot (black box), evoked saccade RF (tip of the brown arrow), and the target (green-filled square) are shown for a typical trial. Suprathreshold microstimulation, administered while the monkey prepared a saccadic response to the target, evoked a saccade whose endpoints are shown as black dots for a stimulation time of <100 ms, and blue dots for a stimulation time of >100 ms after target onset. Gray and blue squares represent the median of the endpoint locations. The voluntary saccade that follows the evoked saccade is not shown. B, Systematic changes in the initial angular deviation of the evoked saccade with respect to the RF is shown as a function of stimulation time. The mean deviation (red-filled circles) is fit by a weighted-smoothing spline (solid black line). The dashed blue lines represent the 95% CI. RF, 0°; target, 90°. C, Median RT of the first saccade in a nonstimulated trials in a session is plotted on the x-axis and the slope of the no-step deviation profile for the corresponding session on the y-axis. Each cyan-filled circle represents data from a session (N = 51 sites). Linear regression of the data is shown by the black dashed line.
Figure 4.
Figure 4.
Evoked saccade deviation in step trials. A, In the top row of panels, when a stimulation pulse (blue oscillations) is delivered, a saccade (blue arrow) is evoked. The middle and bottom rows represent a short TSD (16 ms) trial that is microstimulated by either a short-latency (10 ms) or a long-latency (140 ms) pulse. The subsequent panel shows the evoked saccade, the saccade under preparation, and the averaged saccade as blue, black, and red arrows, respectively. Note that the black arrows are shown short of the target to represent saccades under preparation. The right-most panels show the observed saccade. The dots forming the saccade represent the eye position samples. At early stimulation times, the resultant averaged saccade is expected to be toward the initial target while at later stimulation times it is expected to be toward the final target. B, The evoked saccade deviation profile in a typical session for a particular TSD (80 ms) is shown. C, The averaged saccade deviation profile for the session from the three TSDs (16, 80, and 144 ms) is shown after aligning each of them to the onset of the final target. In B and C, the median of the deviation (red circles) is fit by a weighted-smoothing spline (solid black line). The dashed blue lines represent the 95% CI. Crossover time (CT) represents the time when the deviation profiles cross the RF toward the final target (denoted by the red arrow), as estimated from the fit.
Figure 5.
Figure 5.
Behavioral relevance of the crossover time. A, Time line of a stimulated step trial showing the time of onset of the initial target (IT), final target (FT), time of stimulation (Stim), time of evoked saccade (ES) onset, and switch time (ST). B, The three types of behavior that occur depending on the evoked saccade onset with respect to the switch time (shown by the orange horizontal arrow in A). Left, A trial in which the evoked saccade deviated toward the final target and the subsequent voluntary saccade response was made to the final target (DevF-ResF). Middle, A trial in which the evoked saccade deviated toward the initial target and the subsequent voluntary saccade response was made to the final target (DevI-ResF). Right, A trial in which the evoked saccade deviated toward the initial target and the subsequent voluntary saccade response was made to the initial target (DevI-ResI). Green and red squares represent the initial and final target, respectively. The blue square represents the RF at the stimulation site. The sampled eye movement trajectory is shown as black-filled dots. C, Plot showing the relative frequency of the three types of behaviors as a function of the evoked saccade onset with respect to the switch time. In this plot, 0 represents the time of evoked saccade onset, trials to the left of 0 are those in which the switch time occurred before the saccade onset, and trials to the right of 0 are those in which the switch time is yet to occur. Trials are binned into 20 ms bins and the relative frequency was calculated for each time bin. The change in relative frequency of DevF-ResF and the DevI-ResI trials are fit by a linear fit (dashed green and red line). The width of the light brown box and that of the light blue box mark the average latency of the evoked saccade (48 ms) and the evoked saccade duration (25 ms) respectively.
Figure 6.
Figure 6.
Assessment of task performance using microstimulated step trials. A, The probability of making the erroneous first saccade in the nonstimulated trials (black squares that are line-fit with a black line) is plotted on the y1-axis as a function of TSD. The y2-axis shows the normalized deviation (solid gray circles that are line-fit with a gray line; obtained from stimulated trials as a function of TSD. B, The normalized deviation (y-axis) is plotted against the probability of error (x-axis), with the gray solid line depicting the linear fit and the dashed black line depicting the line of unity slope. Note that the slope of the linear fit is close to unity. C, The slopes of the linear fit to the data, as described in B, are shown as a boxplot (N = 50 sites). The black line at the center represents the median, the notch represents the 95% confidence limit of the median, the extent of the box is the interquartile range, and the whiskers represent the range.
Figure 7.
Figure 7.
Models of redirect behavior. A, Architecture of different GO-GO and the GO-STOP models. The accumulator units (GO1, GO2, and STOP) that accrue information at rates defined by their respective parameters (μ and σ) are interconnected by mutually inhibitory connections (black lines terminating in red-filled circles) of strength β. B, The compensation function generated by the different models (colored line fits) is shown with the observed compensation function (in blue) adapted from Figure 1C. C, The residual variance across all sessions is represented by a boxplot for each of the models. Whiskers, Range; blue box, interquartile range; notch, 95% confidence limit; red line, median. D, Saccade RT distributions. The cumulative RT distribution of the erroneous saccade (left) and the successful saccade (right) for both the data and each of the simulated models is plotted for the example session. The data have been grouped into 40 ms time bins.
Figure 8.
Figure 8.
Comparison of the model fits to the evoked saccade deviation profile. A, The evoked saccade deviation profile in step trials as predicted by the different models (colored line fits) is shown with the observed deviation profile (in blue, adapted from Fig. 4C). The y-axis represents normalized deviation. B, The residual variance, calculated based on the predicted and observed evoked saccade deviation profile, for all sessions, is represented by a boxplot for five of the models. The boxplot conventions are as in Figure 7C. C, The scatter plots compare the predicted and observed time of crossover (top row of panels) and the range of the deviation profile (bottom row of panels) for five models. In all panels in C, each data point represents the estimates from a session, and the dashed line represents the line of unity slope.

Comment in

References

    1. Aron AR, Verbruggen F. Stop the presses: dissociating a selective from a global mechanism for stopping. Psychol Sci. 2008;19:1146–1153. - PubMed
    1. Aslin RN, Shea SL. The amplitude and angle of saccades to double-step target displacements. Vision Res. 1987;27:1925–1942. - PubMed
    1. Barborica A, Ferrera VP. Modification of saccades evoked by stimulation of frontal eye field during invisible target tracking. J Neurosci. 2004;24:3260–3267. - PMC - PubMed
    1. Becker W, Jürgens R. An analysis of the saccadic system by means of double step stimuli. Vision Res. 1979;19:967–983. - PubMed
    1. Boucher L, Palmeri TJ, Logan GD, Schall JD. Inhibitory control in mind and brain: an interactive race model of countermanding saccades. Psychol Rev. 2007;114:376–397. - PubMed

Publication types

LinkOut - more resources